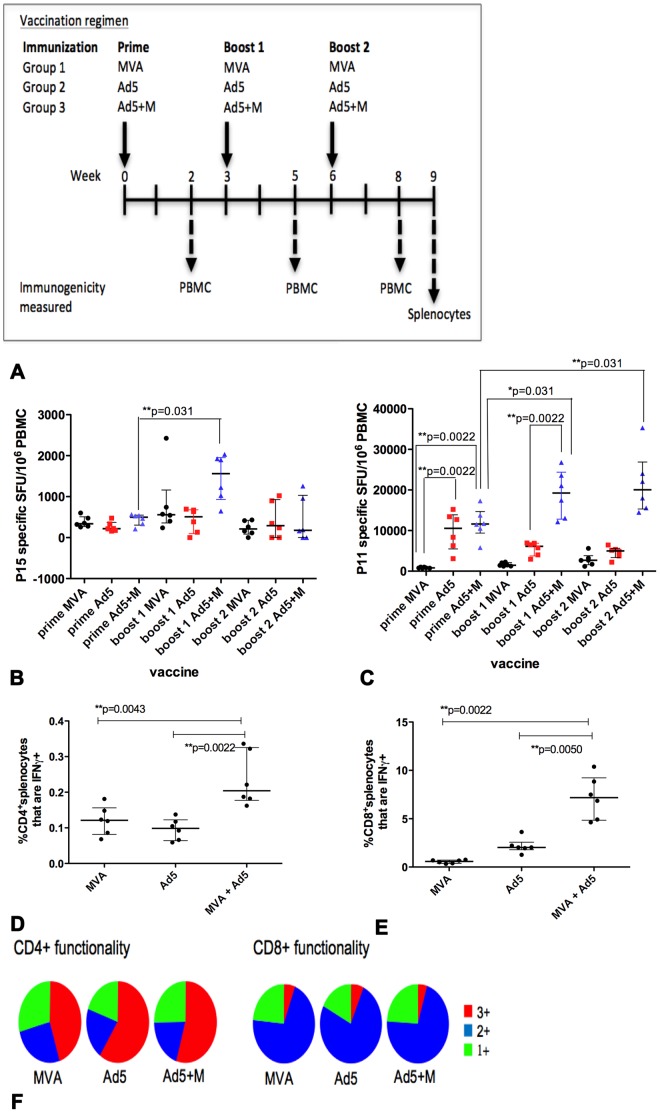
Figure 1. Measurement of vaccine induced immunogenicity two weeks after each vaccination.
Groups of mice (n = 6/group) were primed i.d. with Ad5, MVA or Ad5+M expressing Ag85A and received a homologous boost at 3 weeks and 6 weeks after the prime (A). IFN-γ release by PBMC stimulated with the BALB/c Ag85A immunodominant CD4+ T cell epitope p15 (B) and CD8+ T cell epitope p11 (C) was measured 2 weeks after each vaccination by ELISpot. Splenocytes were stimulated with the total Ag85A peptide pool 3 weeks after the final vaccination and IFN-γ, IL-2 and TNF-α intracellular cytokine staining was measured by flow cytometry. The frequency of CD4+ IFN-γ+ (D) and CD8+IFN-γ+ splenocytes (E) and the number of cytokines co-produced (1+, 2+, 3+) in CD4+ and CD8+ splenocytes (F) was analysed. 1+ and 2+ indicates production of any one or two of the three cytokines measured respectively. 3+ indicates co-production of all three cytokines. Data is representative on one experiment. The median and interquartile range is displayed (B–E).

