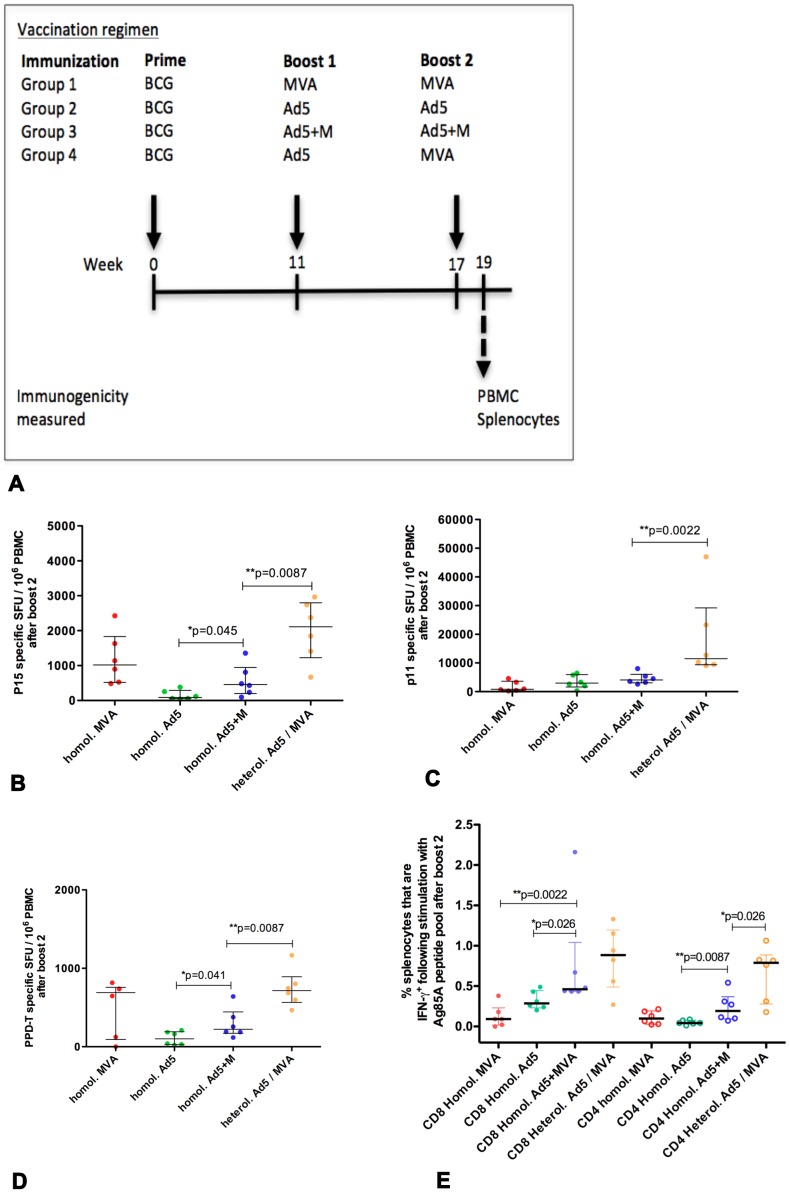
Figure 3. Measurement of vaccine induced immunity following a BCG prime and boosting.
Mice were primed i.d. with BCG and boosted i.d. at 11 and 17 weeks after the prime with successive homologous (homol.) injections of Ad5, MVA, Ad5+M mixture or a heterologous (heterol.) vaccination with Ad5 followed by MVA (A). Antigen specific IFN-γ release was measured by ELISpot from PBMC isolated from tail bleeds 2 weeks after the second boost (B–D). PBMC were stimulated with P15 (B), P11 (C) or PPD-T (D). Splenocytes were harvested 2 weeks after the second boost and stimulated with Ag85A peptide pool to measure Ag85A specific intracellular IFN-γ production by CD8+ (filled symbols) and CD4+ (empty symbols) cells (E). Data is representative on one experiment. The median and interquartile range is displayed (B–E).

