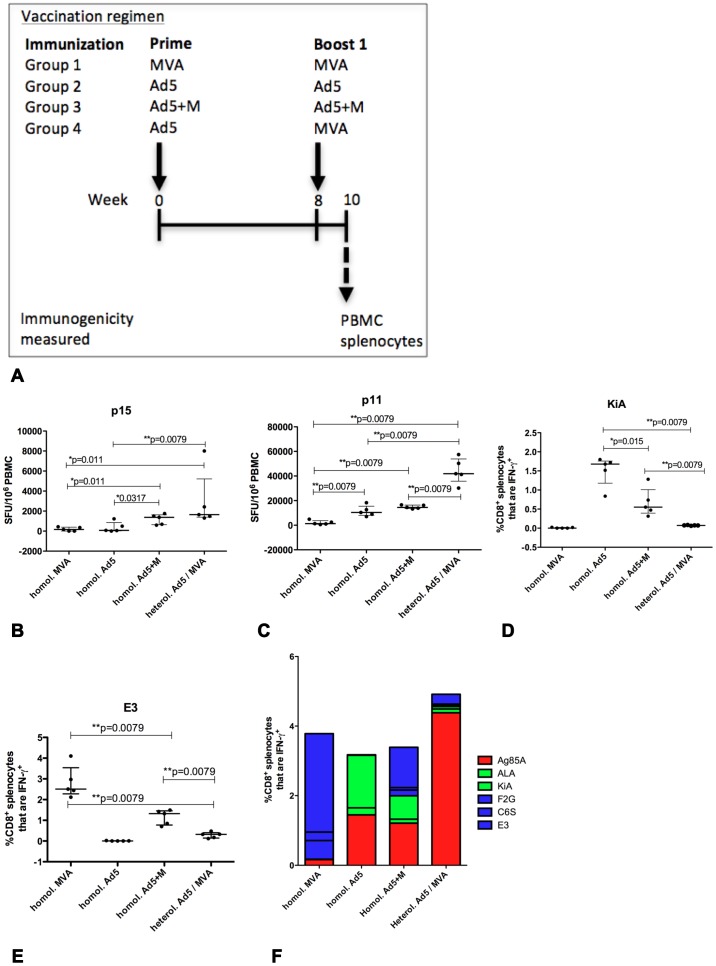
Figure 4. Measurement of anti-vector immunity following vaccination.
Groups of (n = 5) mice were primed i.d. with Ad5, MVA or Ad5+M expressing Ag85A and received a homologous boost 8 weeks later (A). An additional group of mice (n = 6) received a heterologous prime-boost with an Ad5 prime followed by an MVA boost 8 weeks later. PBMC (B–C) and splenocytes (D–F) were harvested from all groups two weeks after the boost. PBMC were stimulated with the immunodominant CD4+ epitope P15 and CD8+ T cell epitope P11 (B, C respectively) to measure IFN-γ release by ELISpot. Splenocytes were stimulated with KiA and E3 anti-vector T cell epitopes (D, E respectively) before ICS and gating on CD8+ splenocytes. The median and interquartile range is displayed (B–E). The average frequency of CD8+ splenocyte IFN-γ+ responses to P11 and ALA, KiA, F2G, C6S and E3 vector specific epitopes by mice in each vaccine regimen, as measured by ICS, is displayed (F). Data is representative on one experiment.

