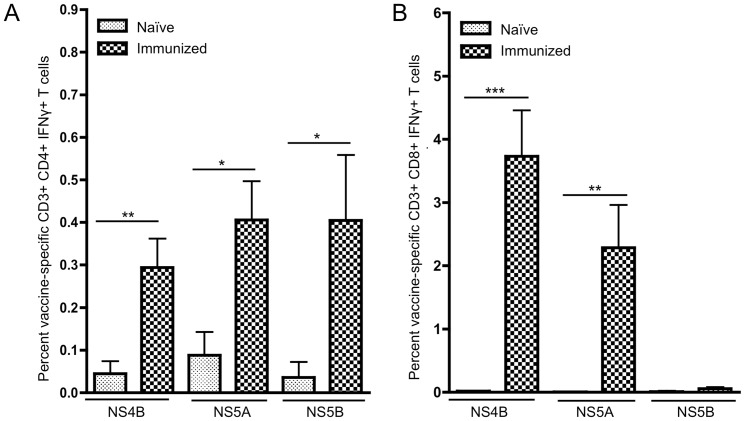
Figure 2. Flow cytometric analysis of the percentage of HCV-specific IFN-γ+ T cell responses from isolated liver lymphocytes.
Values are reported as the average percent ± SE of HCV-specific A) CD4+ IFN-γ+ or B) CD8+ IFN-γ+ T cell responses of each animal (n = 5) from each group. Significance was determined by Student's t test (*p<0.05, **p<0.005 and ***p<0.0005).

