Figure 2.
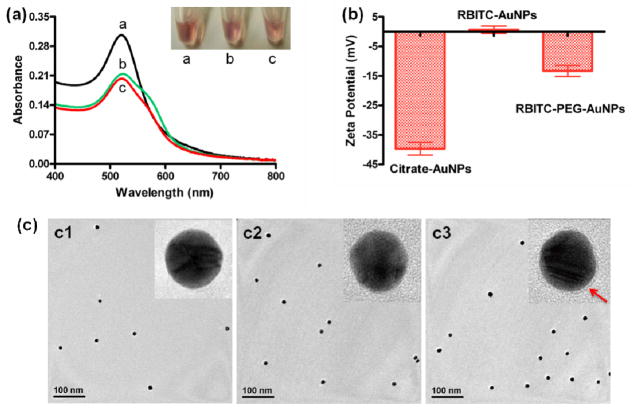
(a) UV-vis spectra of citrate-AuNPs (a1), RBITC-AuNPs (a2) and RBITC-PEG-AuNPs (a3) and their corresponding solution colors. (b) Zeta potentials and (c) TEM images of citrate-AuNPs (c1), RBITC-AuNPs (c2), and RBITC-PEG-AuNPs (c3). High-resolution TEM was performed to analyze the organic layers surronding AuNPs. The red arrow indicates the PEG layer on the AuNP surface.

