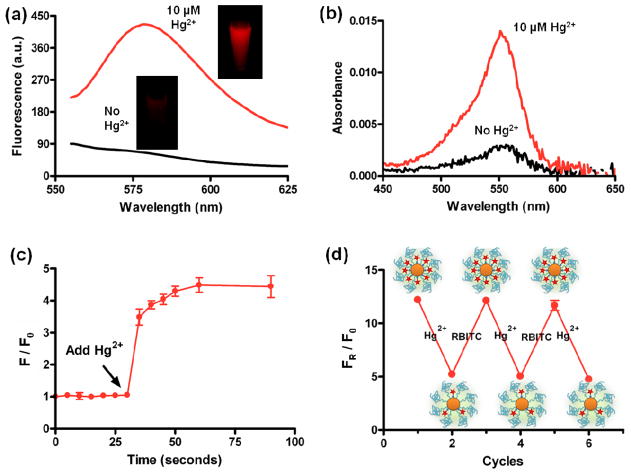
Figure 4.
(a) Fluorescence emission spectra and photograph (Inset) of the RBITC-PEG-AuNPs solutions (2.5 nM) before and after addition of 10 μM of Hg2+ ions, and (b) their corresponding UV-vis spectra of released RBITC after centrifugation. (c) Plot of F/F0 values versus time upon the addition of 10 μM of Hg2+ ions into RBITC-PEG-AuNPs solution. (F and F0 are fluorescence intensity at 580 nm in the presence and absence of Hg2+). The arrow indicates the starting time of Hg2+ addition. (d) The FR/F0 values of RBITC-PEG-AuNPs solutions after incubation with Hg2+ and free RBITC alternatively. FR represents the fluorescence intensity of the remaining RBITC left on the RBITC-PEG-AuNPs (released by 100 mM of DTT) while F0 represents the fluorescence intensity of RBITC-PEG-AuNPs.

