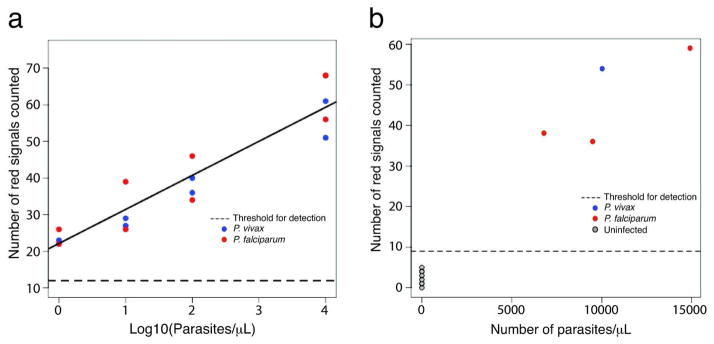
Figure 3. REEAD-on-a-Chip analyses of Plasmodium infected blood or saliva samples.
a, graphic representation of a quantitative analyses of blood samples from patient #1 (P. falciparum), or #5 (P. vivax) diluted by uninfected blood to a parasite density of 10,000, 100, 10 or 1 parasite/μL. The total numbers of pTopI-specific signals on the individual slides are plotted as a function of Log10 to numbers of parasites/μL in the individual samples. Red and blue dots show the results of two repeated analyses of the P. falciparum and P. vivax samples, respectively. As a reference a panel of blood samples from 11 uninfected patients (#6–#16) were analyzed and used to determine an approximate threshold for detection with a significance level of α=10−3 (dotted line). b, samples of saliva from three P. falciparum (red dots), one P. vivax (blue dot), and eight uninfected (grey dots) individuals were analyzed using the REEAD-on-a-Chip setup. The total numbers of pTopI-specific signals observed on each slide are plotted as a function of parasite density observed in the blood from the infected patients. The dotted line shows an approximate threshold for detection with a significance level of α=10−3.

