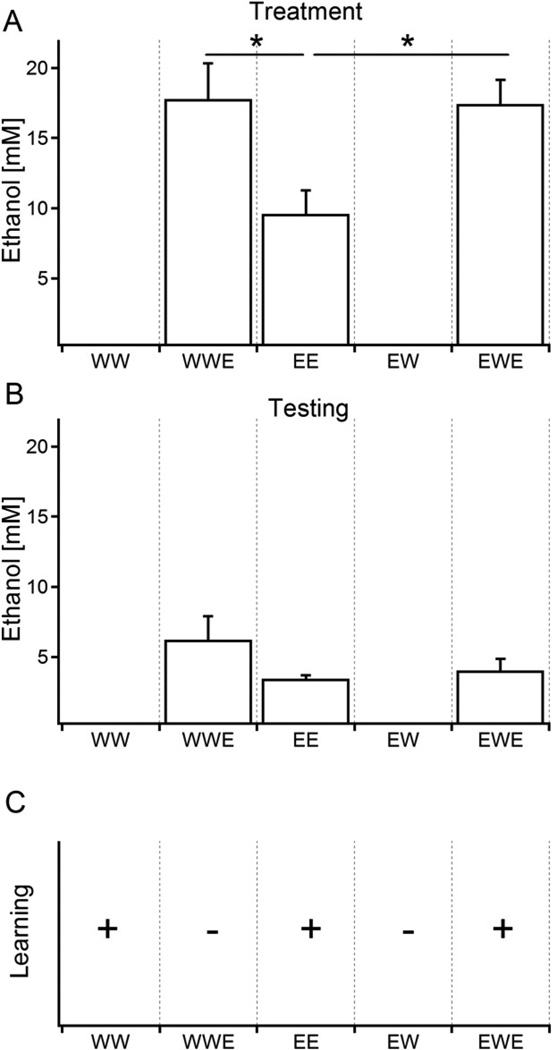
Figure 4. Quantification of internal ethanol concentration.
A) Larvae were individually picked out of the food, rinsed to remove clinging food, and analyzed for ethanol content. The means were found to be significantly different (*p=0.005) and posttests indicate that both WWE and EWE larvae had higher internal ethanol concentration than EE larvae (* p<0.05; N=13). WW and EW larvae did not contain measurable ethanol (detection threshold of ~0.5 mM). B) The en masse PEG larvae purification reduces internal ethanol but WWE, EE, and EWE larvae did not have statistically different levels of ethanol following PEG purification (p=0.1543; N=8) C) Summarized learning capacity of each category of larvae as determined in Figures 2 and 3. Plus signifies normal and minus signifies a poor capacity to learn. The poor capacity to learn in the EW group also correlates with larval nervous system hyperexcitability (see Figure S2). Error bars represent the standard error of the mean (SEM).

