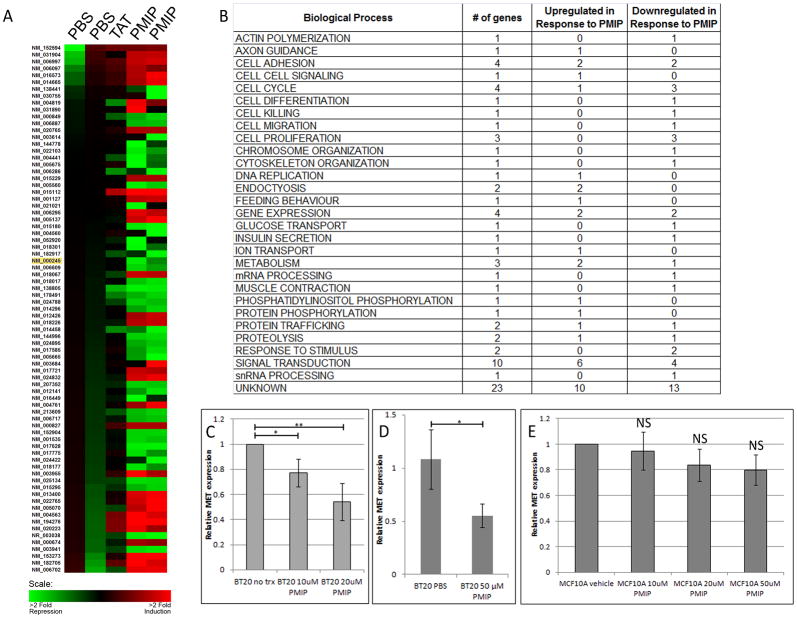
Figure 2.
PMIP treatment changes gene transcription. BT20 breast cancer cells (A–D) or MCF10A immortalized breast epithelial cells (E) were treated with 50 μM PMIP, control peptide (TAT), or vehicle (PBS) and analyzed for differences in gene expression. (A) Induction of gene expression (red) and repression of gene expression (green) are shown for the ninety-seven expression changes detected. The accession number for c-Met is highlighted in yellow. (B) Changes in gene expression grouped by biological process. (C) RNA was extracted from untreated BT20 cells or cells treated with PMIP and analyzed for relative MET expression by RT-PCR. MET expression is normalized to ACTB expression. (D) RNA was extracted from BT20 cells treated with PMIP or vehicle (PBS) and analyzed for relative MET expression by qRT-PCR. MET expression is normalized to ALAS1 expression. (E) RNA was extracted from MCF10A cells treated with PMIP or vehicle (PBS) and analyzed for relative MET expression by RT-PCR. * p<0.05, ** p<0.01, *** p<0.001, NS=no significance.

