
Figure 6. Visualization of the receptor binding pocket by homology modeling and docking. Three dimensional plot of S1P3 binding to (A) S1P, (B) CYM-5541, and (C and D) both.


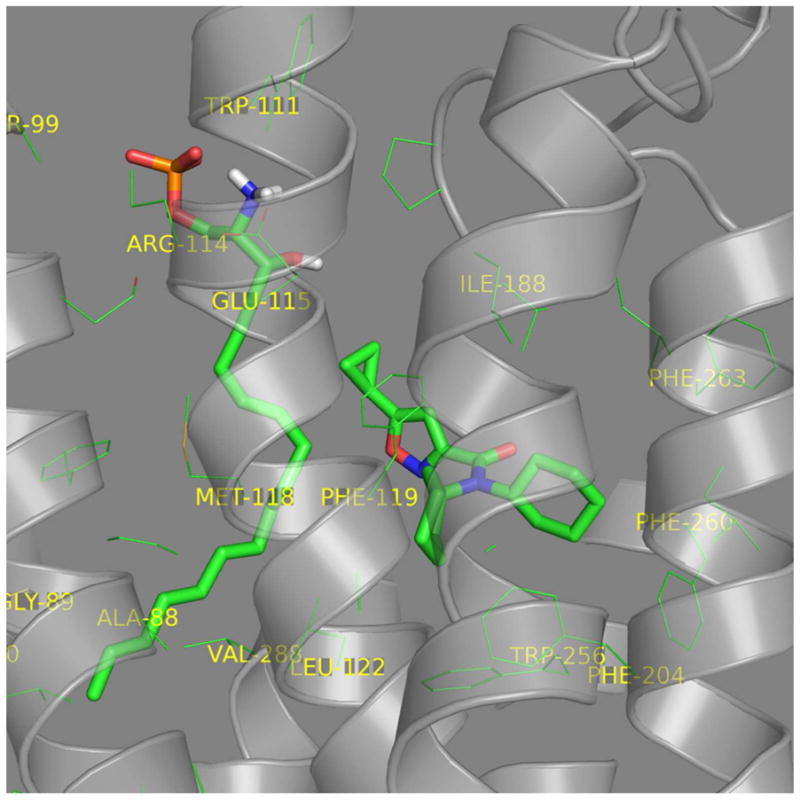
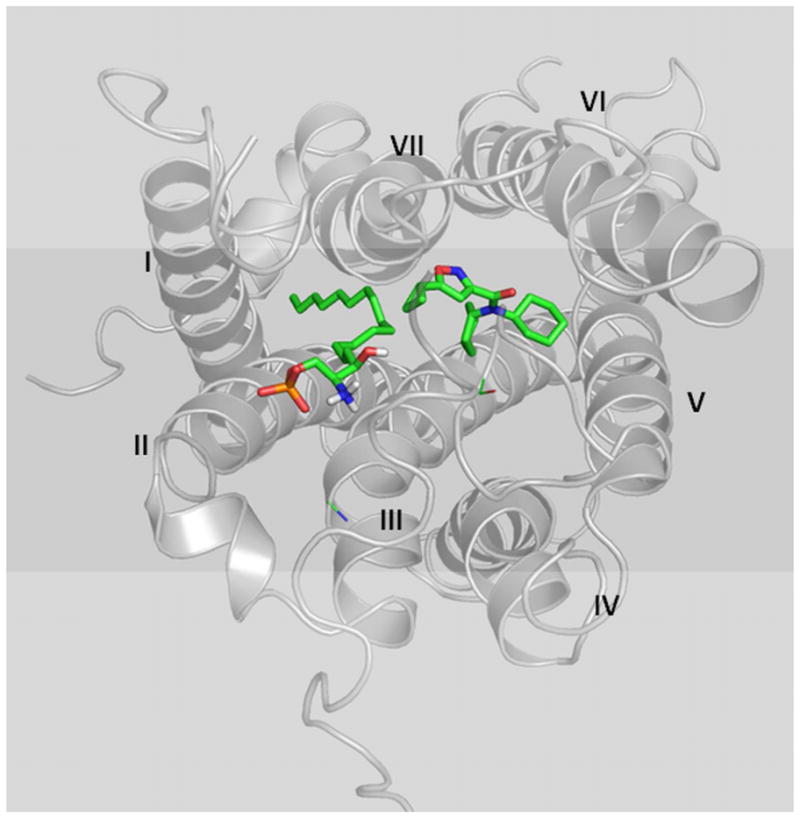

(A) S1P headgroup interacting with R114 and E115. (B) CYM-5541 in the hydrophobic pocket. (C) S1P and CYM-5541 co-docked to S1P3. In the presence of S1P, the pocket opens up in the lower hydrophobic region adjusting CYM-5541 (after 5ns MD optimization). (D) Top view from the extracellular surface with helix orientation identical to the other panels. Detailed modeling and docking procedures are described in Methods section. (E) Calcium response assay upon co-application of S1P and CYM-5541 to S1P3-CHO cells. When both S1P and CYM-5541 were added to S1P3-CHO cells, calcium release response was increased, indicating their additive responses (Mean ± SEM; n=9).