Figure 5.
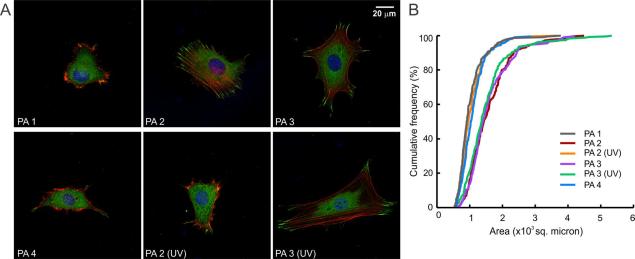
Cell response to photo-responsive PA and controls. (A) Representative morphologies of 3T3 fibroblasts on various PA coated surfaces (with or without UV exposure). Staining for actin (phalloidin, red) and vinculin (green) reveals the cytoskeletal organization and focal adhesions respectively. (B) A cumulative distribution plot of projected cell surface area, where each point represents the total percentage of cells smaller than the given area. The data show an increased cell spreading in the presence of RGDS epitopes (PAs 2, 3, and 3 (UV)); this response was absent when the epitopes were not included or removed by photo-irradiation (PAs 1, 2 (UV), and 4).

