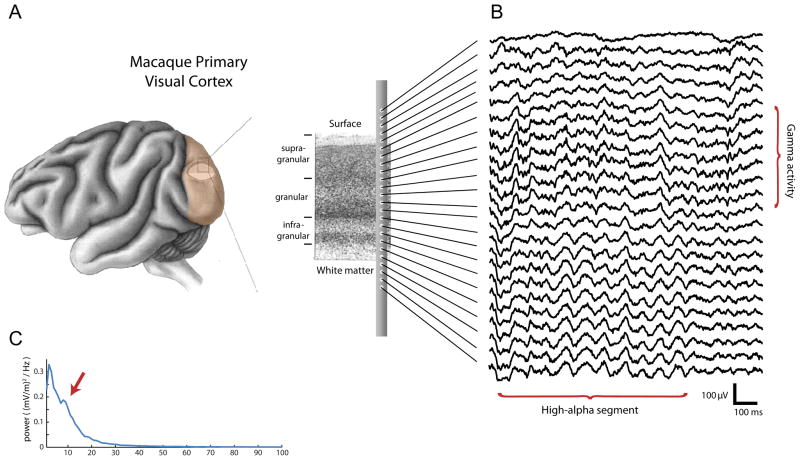
Figure 1. Overview of the type of data we acquired.
(A) Continuous electrophysiological activity was simultaneously recorded from all layers of primary visual cortex using a 24-contact laminar probe in two monkeys. (B) Example of the recorded voltage traces. The example traces shows more prominent gamma activity in the superficial layers, and a transient segment of alpha activity in the deep layers (about 9 cycles). (C) The power spectrum of bipolar data in infragranular layers. Note the local peak at in the alpha band, indicated by the arrow.

