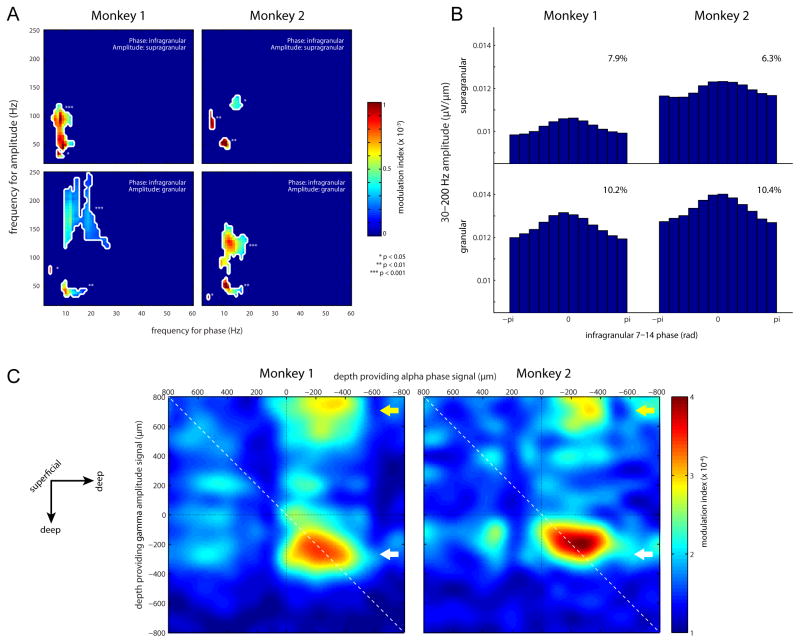
Figure 3.
Modulation Index (MI) analysis for phase-amplitude coupling. (A) MI values as shown for four representative bipolar channel pairs (each from a single recording session). Only significant MIs values are shown. The significance values are corrected for multiple comparisons by a shift-predictor cluster permutation approach. (B) Granular/supragranular gamma amplitude as a function of binned infragranular alpha phase, averaged over all recording sessions. The effect size of the modulation is shown in the inserts. (C) Topographical representations of the alpha (7–14 hz) to gamma (30–200 Hz) MI when considering all electrode combinations. The arrows indicate the deep layer alpha phase modulation of the granular (white arrow) and supragranular (yellow arrow) gamma amplitude.

