Figure 3.
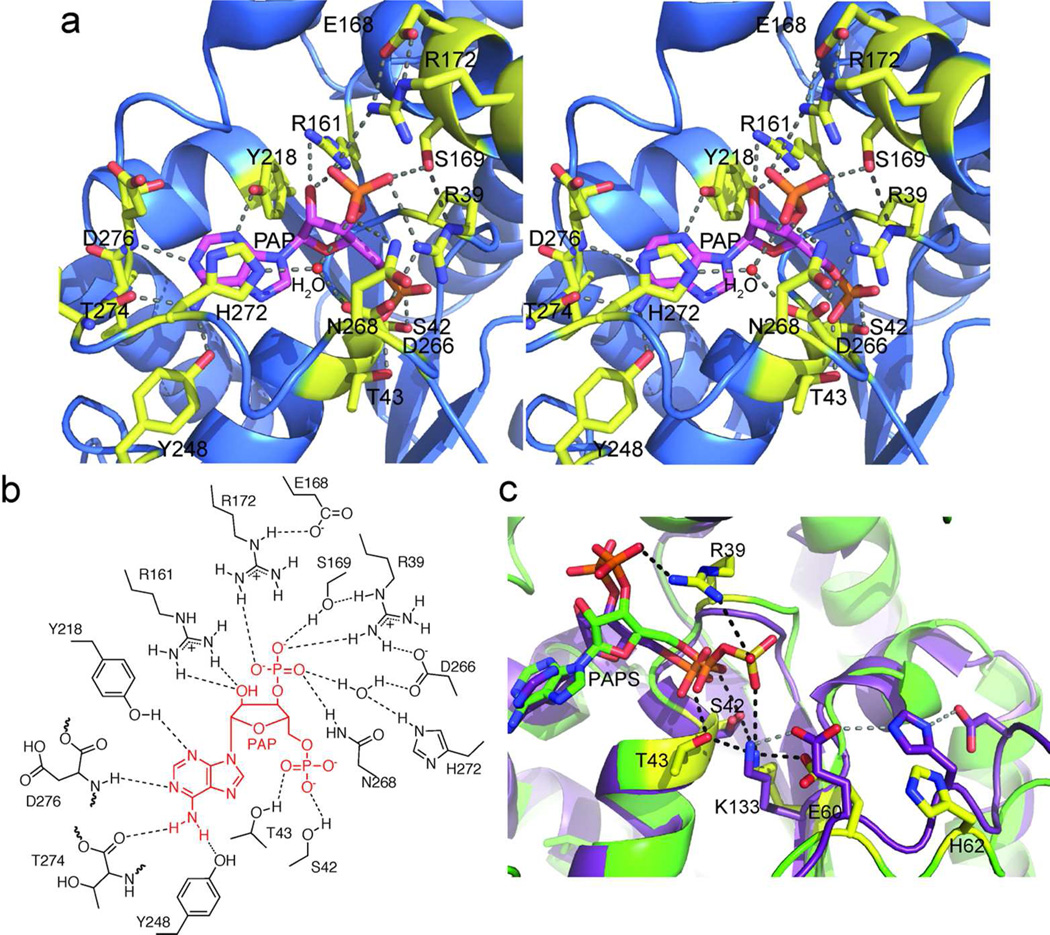
Active site of activating STs. a) OLS ST PAP binding site. PAP (magenta C) and surrounding amino acids (yellow C) in an intricate hydrogen-bonding network are shown in stick form in the stereo diagram. b) Schematic of PAP binding site. c) Comparison of the active sites of CurM ST and 3-OST. Key amino acids are shown in stick form in 3-OST (1T8U) (25) (purple C) and CurM ST (yellow C). Hydrogen bonds in CurM ST and the ionic interaction from Lys133 to PAP are shown in black. Hydrogen bonds in 3-OST are shown in gray. PAPS is modeled into CurM ST from the positions of PAP and ZnCl3−.

