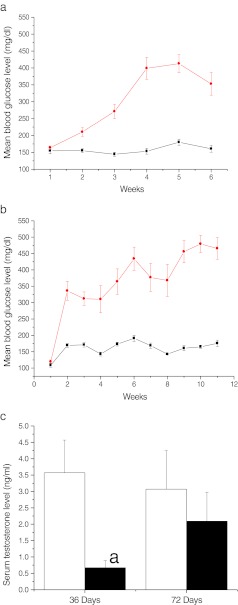
Fig. 1.
Streptozotocin induced hyperglycemic response a) weekly levels of blood glucose in diabetic-36 (black circle) and corresponding control (black square) group b) weekly levels of blood glucose in diabetic-72 (black circle) and corresponding control (black square). c) Serum testosterone level in diabetic (black square) and control (white square) ap < 0.05 compared to corresponding control group

