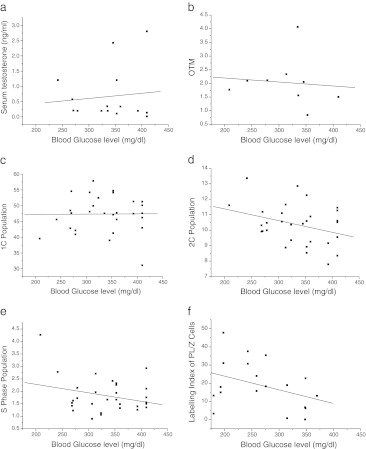
Fig. 5.
Association between blood glucose level and a) serum testosterone level in diabetic-36 group, R2 = 0.01 b) Olive tail moment in diabetic-36 group, R2 = 0.01 c) 1C population in diabetic-36 group, R2 = 0 d) 2C population in diabetic-36 group, R2 = 0.1 e) S-phase population in diabetic-36 group, R2 = 0.08 f) Labeling index in diabetic-32 group, R2 = 0.14

