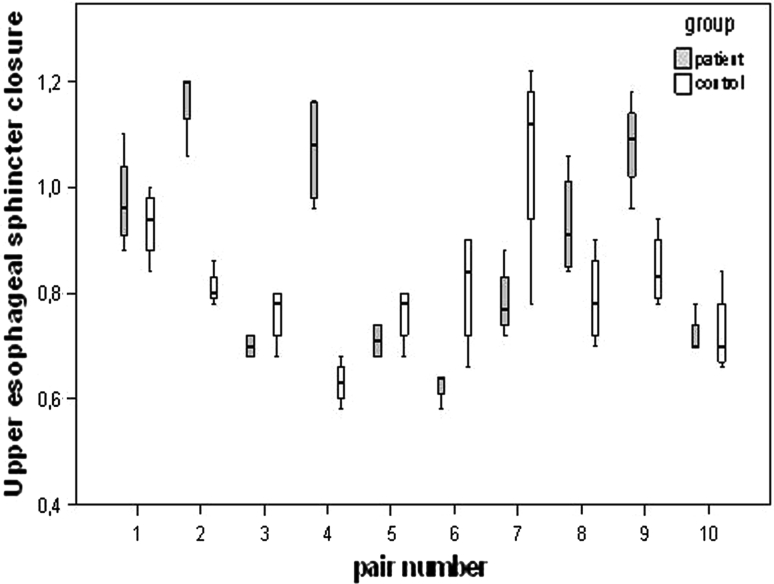
Fig. 5.
Box plots of UESc (upper esophageal sphincter closure in seconds) showing the nesting of subjects within each matched patient–control pair. For UESc a statistically significant difference is observed between the two groups after adjustment for electrode position and electrical current status (current on/off) which are both not significant

