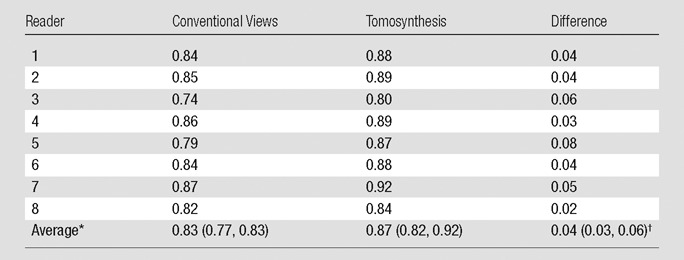
Table 2.
Reader-specific and Reader-averaged Area Under the Probability-of-Malignancy–based ROC Curves

Data in parentheses are the 95% confidence intervals. Confidence intervals and P value account for the correlation between the estimates of the reader-specific AUC and variability between readers.
P < .001 for testing differences is the average AUC.
