
Figure 3. Recombinant prestin–pHluorin protein as a pHi sensor in CHO cells.
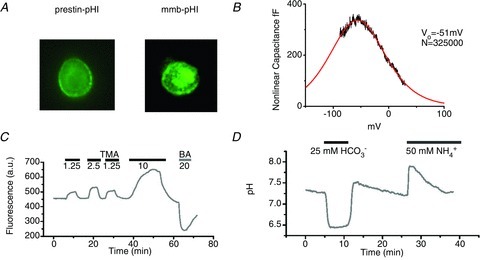
A, expression pattern of the prestin–pHluorin protein in CHO cells (prestin–pHl) and membrane–pHluorin (mmb–pHl) as the control. Both wide-field images from experimental sequences show predominant membrane localisation of the label. These membrane regions were analysed for the data shown in subsequent figures. B, non-linear capacitance trace of a CHO cell identified by its pHluorin fluorescence pattern. The continuous curve is the fitted derivative of a Boltzmann curve CNL= 4 CmaxΦB(1 –ΦB) where ΦB= 1/(1 + exp(β(V – Vo)) and β= 1/43 mV and Vo=−51 mV. The number of equivalent charge carriers, N, was calculated to be 3.25 × 10⁵ (Chambard & Ashmore, 2003). C, calibration of raw fluorescence data using modified method of Szatkowsky and Thomas (see Methods). The trace shows the pHluorin signal with excitation at 470 nm and emission above 510 nm. Solutions shown with concentrations (in mm) of trimethylamine (TMA) or butyrate acid (BA) were applied as indicated. D, time course of the pH-calibrated pHluorin signal. Extracellular solutions containing 25 mm HCO3− equilibrated with 5% CO2 or 50 mm NH4+ were applied at the times indicated.