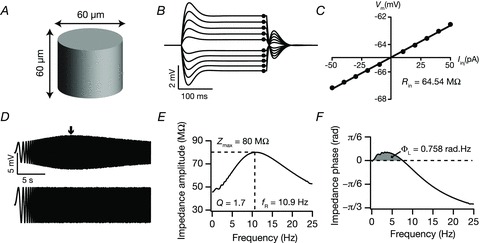
Figure 1. Model and measurements used in this study.

A, schematic diagram of the model used to study excitability and IRD of hippocampal pyramidal neurons. B, voltage traces in response to current injection from −50 to 50 pA in steps of 10 pA for 250 ms. C, steady state voltage response (black dots in B) plotted against the corresponding current amplitude to obtain V–I plot. Slope of the best linear fit to V–I was taken as input resistance (Rin). D, a chirp current stimulus, 50 pA in amplitude and frequency linearly increasing from 0.1 to 25 Hz in 25 s (lower trace) and corresponding voltage response in the presence of h conductance (upper trace). E and F, impedance amplitude profile (E) and impedance phase profile (F) obtained from the voltage response to the chirp stimulus, shown in D. Grey shaded area in F corresponds to the total inductive phase, ΦL.
