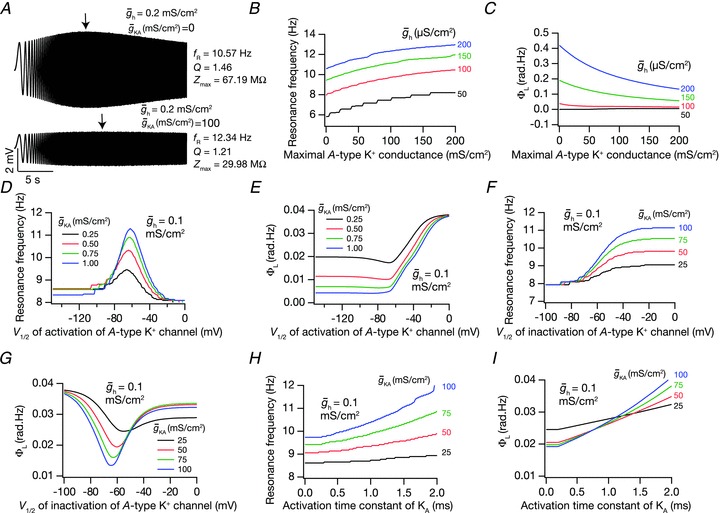
Figure 4. Coexpressing the A conductance with the h conductance was analogous to the presence of leak channels in terms of modulating IRD measurements.

A, voltage traces in response to chirp stimulus in the presence of h conductance alone (upper trace), and in the presence of both h and A conductances (lower trace). B and C, plots showing fR (B) and ΦL (C) as functions of maximal A conductance ( ), for various values of maximal h conductance (
 ). D and E, plots showing fR (D) and ΦL (E) as functions of half-maximal activation voltage of the A conductance, for various values of
  . F and G, plots showing fR (F) and ΦL (G) as functions of half-maximal inactivation voltage of the A conductance, for various values of
  . H and I, plots showing fR (H) and ΦL (I) as functions of activation time constant of the A conductance, for various values of
  . The same maximal h conductance (
 = 0.1 mS cm−2) was used for simulation results shown in D–I. Also see Fig. S14 and Table 5 for a complete analysis of the interactions of these two channels in determining neuronal IRD.
