
Figure 1. PPFamp and PPPdecay at GC–IN synapses in rat cerebellar cortex.
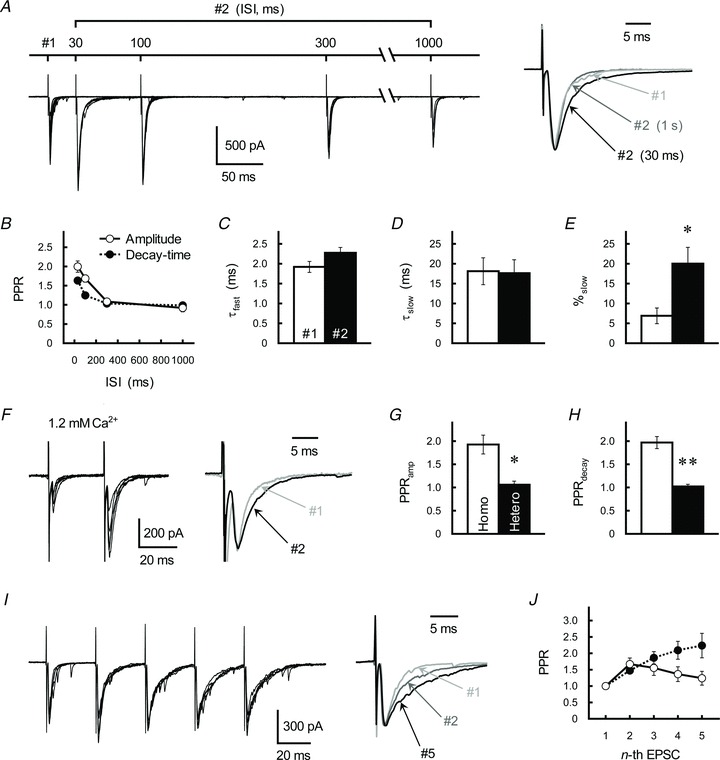
A, effects of PP stimulation on GC-IN excitatory transmission. Left, traces represent superimpositions of five successive EPSCs recorded from a single IN. GC axons were repetitively stimulated with ISIs of 30, 100, 300 or 1000 ms. Right, averaged traces of the first (#1, light grey trace) and second (#2, ISI of 30 ms, black trace; ISI of 1 s, dark grey trace) postsynaptic currents evoked at GC–IN synapses. Each trace was scaled to the same peak amplitude. B, relationship between ISI and the PPRamp (open circles) and the PPRdecay (filled circles). Each point represents the mean ± SEM (n= 11). C–E, summary of kinetics of the second EPSC (ISI of 30 ms), as fitted by a double-exponential procedure. Each column represents the mean ± SEM (n= 9–11). *P < 0.05. F, GC-IN EPSCs examined in 1.2 mm Ca2+-containing ACSF. Left, traces represent superimpositions of five successive EPSCs recorded from a single IN. GC axons were repetitively stimulated with an ISI of 30 ms. Right, averaged traces of the first (grey trace) and second EPSCs (black trace) were scaled to the same peak amplitude. G and H, PPRamp (G) and PPRdecay (H) of the GC-IN EPSCs evoked by repetitive (Homo, open columns) or alternative (Hetero, filled columns) stimulation of the independent GC fibres converging onto the single IN (ISI of 30 ms). Two independent ascending GC axons were repetitively (homo) or alternately (hetero) activated by two different stimulation electrodes with an ISI of 30 ms. If a significant PPFamp occurred in the alternative stimulation experiment, the sample was discarded from further analysis. Each column represents the mean ± SEM (n= 5). **P < 0.01. I, effects of repetitive stimulation on GC-IN EPSCs. Left, traces represent superimpositions of five successive EPSCs recorded from a single IN. GC axons were repetitively stimulated with an ISI of 30 ms. Right, averaged traces of the first (#1, light grey trace), second (#2, dark grey trace) and fifth (#5, black trace) postsynaptic currents evoked at GC–IN synapses. Each trace was scaled to the same peak amplitude. J, relationship between the number of repetitive stimulations (ISI of 30 ms) and the PPRamp (open circles) and the PPRdecay (filled circles). Each point represents the mean ± SEM (n= 9).