
Figure 2. Further characterization of postsynaptic currents recorded from the IN and PC.
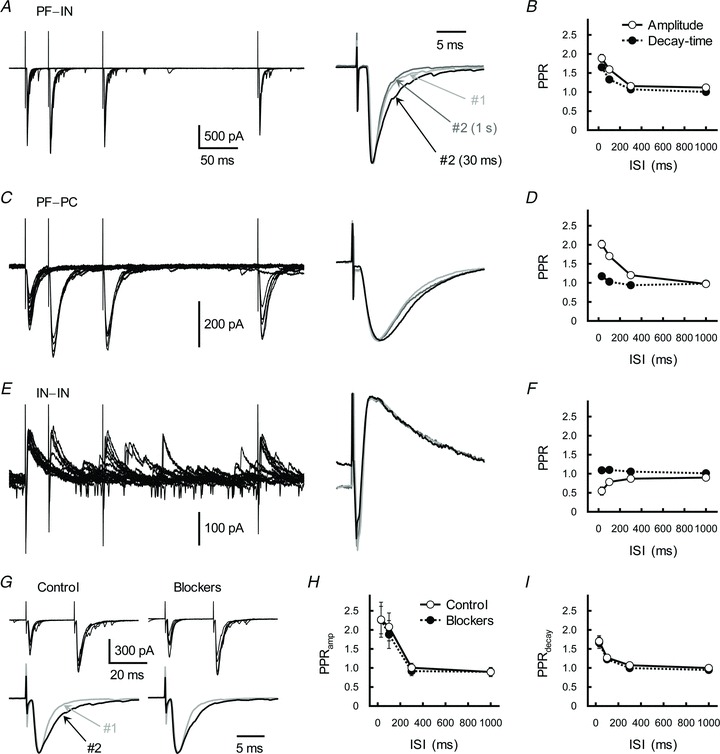
A, C and E, effects of PP stimulation on EPSCs at PF-IN (A) and PF–PC (C) excitatory synapses, and the IPSCs at IN–IN inhibitory synapses (E). Left, traces represent superimpositions of five successive EPSCs/IPSCs recorded from a single IN and PC. GC and IN axons were repetitively stimulated with ISIs of 30, 100 or 300 ms. Right, averaged traces of the first (#1, light grey trace) and second (#2, ISI of 30 ms, black trace; and ISI of 1 s, dark grey trace) postsynaptic currents were scaled to the same peak amplitude. B, D and F, relationship between ISI and the PPRamp (open circles) and the PPRdecay (filled circles) examined at PF–IN (B), PF–PC (D) and IN–IN (F) synapses. Each point represents the mean ± SEM (n= 8–11). G, effects of receptor blockers (d-AP5 (50 μm), AIDA (300 μm) and bicuculline (5 μm)) on GC–IN synaptic transmission. Top, GC axons were repetitively stimulated with an ISI of 30 ms. Traces represent superimpositions of five successive EPSCs recorded from a single IN before (left) and during (right) treatment with the blocker. Bottom, averaged traces of the first (grey traces) and second (black traces) EPSCs were scaled to the same peak amplitude. H and I, relationship between ISI and the PPRamp (H) and the PPRdecay (I) before (control, open circles) and during (filled circles) treatment with the mixture of receptor blocker. Each point represents the mean ± SEM (n= 7).