
Figure 3. A multi-step simulation of postsynaptic conductance.
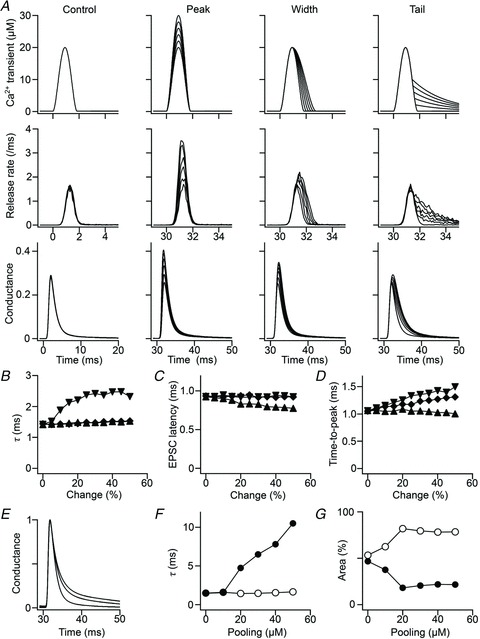
A, effects of modifying the presynaptic Ca2+ transient on vesicular release and postsynaptic conductance. Panels in the top, middle and bottom rows show the Ca2+ transient, release rate per terminal and postsynaptic conductance normalized to the maximum conductance, respectively. The leftmost column shows the control (the first stimulation). The second, third and fourth columns show peak, width and tail modifications, respectively. Six traces are superimposed in each panel. The ordinate is common in each row; the abscissas are common in the top and middle rows. B–D, summary of the simulation. Decay-time constant (B), latency (C) and time-to-peak (D) of the postsynaptic conductance are plotted against change of peak (triangles), width (diamonds) and tail (inverted triangles) of the presynaptic Ca2+ transient (% of control). The decay-time constant was obtained by a single-exponential fitting. E, effects of glutamate pooling on conductance. It is assumed that each vesicular release contributed to pooling, with a peak concentration of 0–50 μm (pooling concentration). The glutamate concentration was assumed to be additive and to decay exponentially (τ was fixed to 8 ms). Conductance traces normalized to the peak are shown for the pooling concentrations of 0, 20 and 40 μm. The trace without pooling was best fitted with a single-exponential function, whereas traces with pooling concentrations ≥20 μm were better fitted with a double-exponential function. F and G, the time constants (F) and percent areas (G) plotted against the pooling concentration for the fast (open circles) and slow (filled circles) components. The simple assumption of a single common pool failed to reproduce the increase in area, but not in time constant, when there was more pooling.