
Figure 4. Relationship between PPF at GC-IN synapses and changes in the properties of postsynaptic AMPARs.
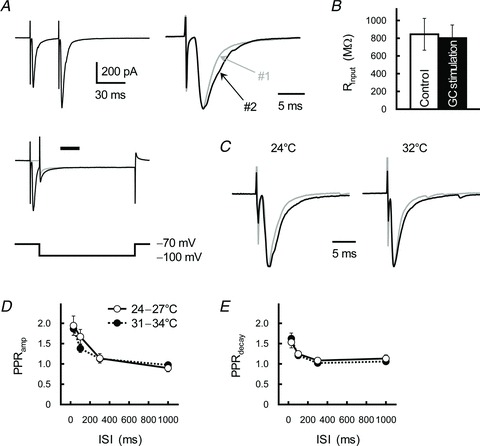
A, stimulation-evoked EPSCs did not change input resistance of the IN. Holding potentials of the IN changed from −70 to −100 mV (left bottom); traces were averaged both before (grey trace) and after (black trace) GC stimulation (left middle). Rinput was calculated 30 ms after the GC stimulation (as indicated by the horizontal bar, a timing of the second EPSC, refer to traces showing at the left top). Superimpositions of averaged traces, scaled to the same peak amplitude, of the first (#1, grey trace) and second (#2, black trace) EPSCs (right). B, summary of the Rinput calculated before (open columns) and after (filled columns) GC stimulation. Each column represents the mean ± SEM (n= 12). C, GC–IN synaptic transmission at a high temperature. GC axons were repetitively stimulated with an ISI of 30 ms. Superimpositions of averaged traces of the first (grey traces) and second (black traces) EPSCs recorded at 24°C (left) or 32°C (right). Each trace was scaled to the same peak amplitude. D and E, relationship between ISI and the PPRamp (D) and the PPRdecay (E) recorded at 24–27°C (open circles) or 31–34°C (filled circles). Each point represents the mean ± SEM (n= 7).