
Figure 6. Effect of PP stimulation on asynchronized EPSCs recorded at GC–IN synapses.
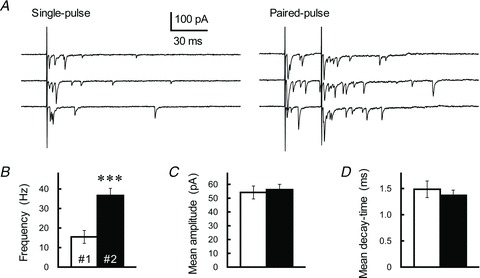
A, asynchronously occurring EPSCs evoked by a single (left) or paired-pulse (ISI of 30 ms, right) GC axon stimulation were recorded from a single IN at least 15 min after perfusion of Sr2+-containing ACSF; three successive sweeps are indicated. B–D, comparison of the frequency (B), mean amplitude (C) and mean decay-time constant (D) of asynchronized EPSCs evoked by first (#1, open columns) or second (#2, filled columns) stimulation. The asynchronized EPSCs were collected during a 300 ms window starting from the GC stimulation. Each column represents the mean ± SEM (n= 5, ***P < 0.001).