
Figure 7. PP stimulation-induced changes in the kinetics of GC-IN EPSCs.
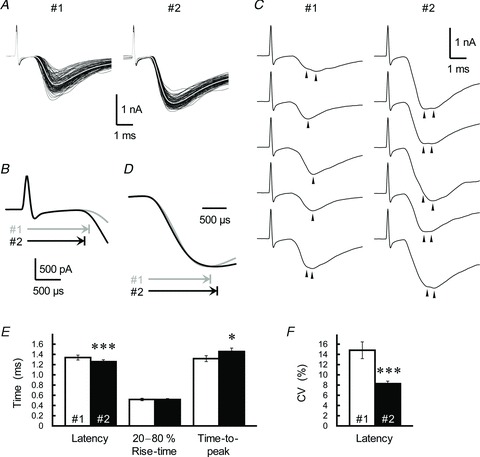
A, 100 consecutive sweeps of the first (#1) and second (#2, ISI of 30 ms) EPSCs were recorded from a single IN. The sampling rate was 50 kHz. The averaged trace is indicated by the grey line. B, superimposition of the rising phases of averaged traces from the first (grey trace) and second (black trace) EPSCs (same data as in A). Horizontal arrows show the latency from the stimulation artefact to the onset of the first and second EPSC. C, representative EPSC doublets from the first and second EPSC pairs (same data as in A). Some EPSCs display a secondary event or an inflection point in their rising phase. Individual events are indicated by arrowheads. D, averaged traces of the first (grey trace) and second (black trace) EPSCs were scaled to the same peak amplitude and aligned at the rising phase of the EPSCs (same data as in A). Horizontal arrows show the time-to-peak from the onset of the first and second EPSCs. E, summary of the kinetics of the first (open columns) and second (filled columns; ISI of 30 ms) EPSCs. Each column represents the mean ± SEM (n= 12). ***P < 0.001, *P < 0.05. F, the trial-to-trial fluctuation of the latency of the first (open columns) and second (filled columns; ISI of 30 ms) EPSCs. CV, coefficient of variation.