
Figure 9. Effects of a retardation of extracellular glutamate diffusion on PPPdecay.
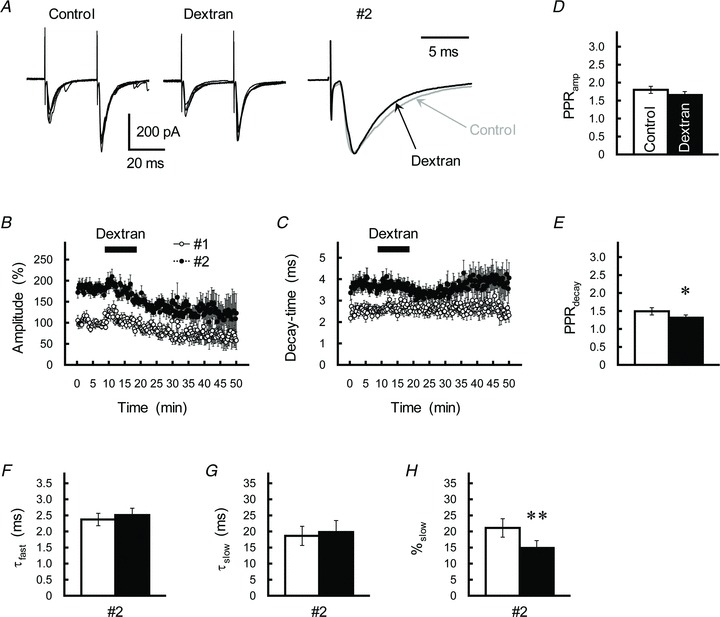
A, effects of the macromolecule dextran (40 kDa, 5% w/v) on GC–IN synaptic transmission. Left and middle, GC axons were repetitively stimulated with an ISI of 30 ms. Traces represent superimpositions of five successive EPSCs recorded from a single IN before (left) and after (middle) treatment with dextran. Right, averaged traces of the second EPSCs before (grey traces) and after (black traces) treatment with dextran were scaled to the same peak amplitude. B and C, time course of changes in the amplitude (B) and decay-time constant (C) of the first (open circles) and second (filled circles) EPSCs during application of dextran (5%). EPSCs were evoked every 15 s by test stimulation. Amplitude is expressed as a percentage of the first EPSC, which was determined before application of dextran. Dextran was applied for 10 min by perfusion (as indicated by the horizontal bar). Each point represents the mean ± SEM (n= 12). D and E, the PPRamp (D) and PPRdecay (E) before (control, open columns) and during treatment with dextran (5%, black columns). Each column represents the mean ± SEM (n= 12, *P < 0.05). F–H, summary of the effects of dextran (black columns) on the kinetics of the second EPSC, as fitted by a double-exponential procedure. Each column represents the mean ± SEM (n= 12, **P < 0.01).