
Figure 11. Contribution of intersynaptic glutamate pooling in eliciting PPPdecay.
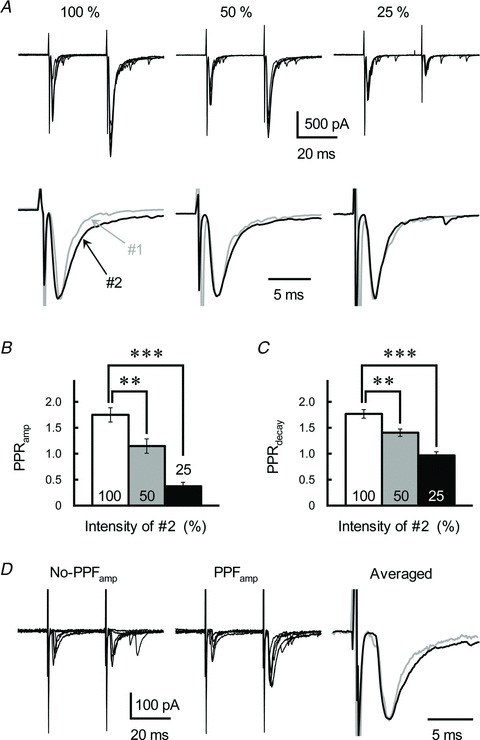
A, effects of reducing the number of activated GC axons on GC–IN synaptic transmission. GC axons were repetitively stimulated with an ISI of 30 ms (top). The intensity of the first stimulation was constant, but the intensity of the second stimulation was reduced as indicated (to half and quarter that of the first stimulation). Traces represent superimpositions of five successive EPSCs recorded from a single IN. Averaged traces of the first (grey traces) and second (black traces) EPSCs were scaled to the same peak amplitude (bottom). B and C, the PPRamp (B) and PPRdecay (C) of the GC-IN EPSCs evoked by repetitive stimulation, where the second stimulation intensity was less than that of the first. Each column represents the mean ± SEM (n= 11, ***P < 0.001, **P < 0.01). D, effects of low-intensity stimulation on GC–IN synaptic transmission. GC axons were repetitively stimulated with an ISI of 30 ms. In some cases, synaptic failure and disappearance of PPFamp was observed (No-PPFamp, left). When clear PPFamp occurred, PPPdecay was also observed (PPFamp, middle). Traces represent superimpositions of EPSCs. For successful PPFamp, averaged traces of the first (grey traces) and second (black traces) EPSCs were scaled to the same peak amplitude (Averaged, right).