
Figure 12. Impact of EPSC decay on the excitability of INs: a dynamic clamp analysis.
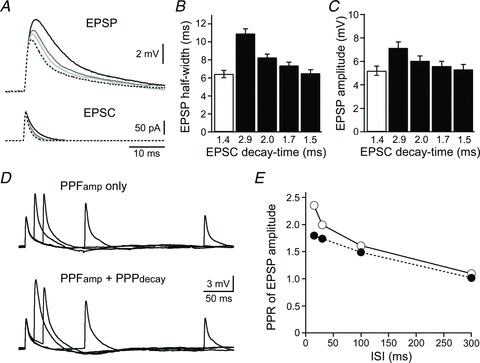
A, representative voltage responses recorded from a single IN (Vm=−65 mV), showing EPSPs (top) in response to EPSCs (bottom) applied with various decay-time constants. Dotted lines indicate EPSCs with decay-time constants of 1.4 ms, and the EPSC-evoked EPSP. Continuous lines indicate EPSCs with decay-time constants of 2.9, 2.0, 1.7 and 1.5 ms, and the EPSC-evoked EPSPs (darker traces correspond to slower EPSC decays). B and C, summary of the EPSP half-width (B) and amplitude (C). Each column represents the mean ± SEM (n= 8). Open columns indicate EPSP responses to EPSCs with decay-time constants of 1.4 ms, which correspond to the first (control) EPSC. Filled columns indicate EPSP responses to EPSCs with decay constants of 2.9, 2.0, 1.7 and 1.5 ms, which correspond to second EPSCs (ISIs of 15, 30, 100 and 300 ms, respectively). D, representative voltage changes recorded from a single IN (Vm=−65 mV), showing EPSPs in response to paired-pulse EPSCs (ISI = 15–300 ms). EPSPs were repetitively evoked with facilitation of EPSC amplitudes (PPFamp only, top), or with facilitation of EPSC amplitudes and slowing of EPSC decays (PPFamp+ PPPdecay, bottom). E, relationship between ISI and the PPR of EPSP amplitude examined with (open circles) or without (filled circles) a decay component. Each point represents the mean ± SEM (n= 8), but SEM is not shown because it is less than the size of the symbols.