
Figure 6. Subthreshold electrophysiological properties of dorsal (DHC) and ventral hippocampal (VHC) dendrites.
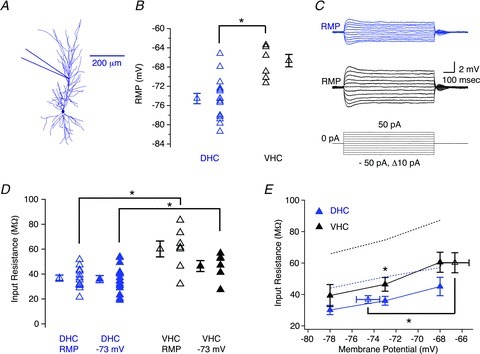
A, morphological reconstruction of a DHC CA1 pyramidal neurone depicting the approximate dendritic recording location for the data presented in this figure (190–306 μm from the soma). B, the resting membrane potential (RMP) was significantly more depolarized for VHC dendrites (black triangles) than DHC dendrites (blue triangles; Student's t test, P < 0.05). C, voltage responses for DHC (blue traces) and VHC (black traces) dendrites in response to 800 ms step current injections ranging from −50 pA to 50 pA in 10 pA increments, elicited from RMP. The RMPs and dendritic recording locations for these representative dendritic recordings were: −80 mV and 196 μm (DHC); and −71 mV and 194 μm (VHC), respectively. D, the value of Rin was significantly higher in VHC dendrites (black triangles) than DHC dendrites (blue triangles) when measured from either RMP (open triangles; Wilcoxon RS test, P < 0.05) or at −73 mV (filled triangles; Wilcoxon RS test, P < 0.05) than VHC neurones (black triangles). E, the dendritic Rin was not significantly different at all membrane potentials tested (−78 mV and −68 mV; Wilcoxon RS test, P > 0.05). Filled triangles indicate Rin measured at the specified membrane potential, whereas open triangles indicate the Rin (at RMP). Dotted lines represent the somatic Rin for DHC (blue dotted line) and VHC neurones (black dotted line), respectively. n values are listed in Table 1.