
Figure 7. Dendritic distance-dependent profiles of resting membrane potential (RMP), Rin (at RMP), and Rin (at −73 mV) for dorsal (DHC) and ventral hippocampal (VHC) neurones.
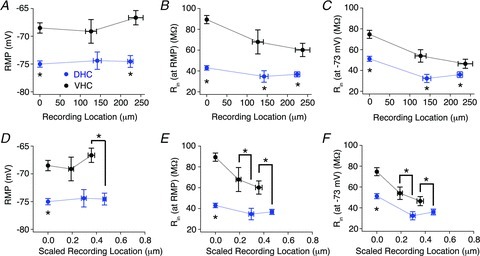
Experiments were binned according to their recording location along the apical dendrite relative to the soma as either somatic (<10 μm), pSR (<190 μm) or dSR (>190 μm), and RMP (A), Rin (at RMP) (B) and Rin (at −73 mV) (C) were plotted according to their somatodendritic recording location. A, RMP was significantly more depolarized in VHC (black circles) neurones than DHC neurones (blue circles) at somatic and dSR recording locations (Wilcoxon RS test; somatic P < 0.05, pSR P > 0.05, and dSR P < 0.05). B and C, Rin (at RMP) (B) and Rin (at −73 mV) (C) were significantly higher for VHC (black circles) neurones than DHC neurones (blue circles) at all three somatodendritic recording locations (Rin (at RMP): Wilcoxon RS test; somatic P < 0.05, pSR P < 0.05 and dSR P < 0.05; Rin (at −73 mV): Wilcoxon RS test; somatic P < 0.05, pSR P < 0.05 and dSR P < 0.05). D–F, dendritic recording locations were normalized to the length of the apical dendrite and plotted against RMP (D), Rin (at RMP) (E) and Rin (at −73 mV) (F). These graphs highlight the limited fraction of the apical dendrite accessible to whole-cell dendritic recordings. n values are listed in Table 1.