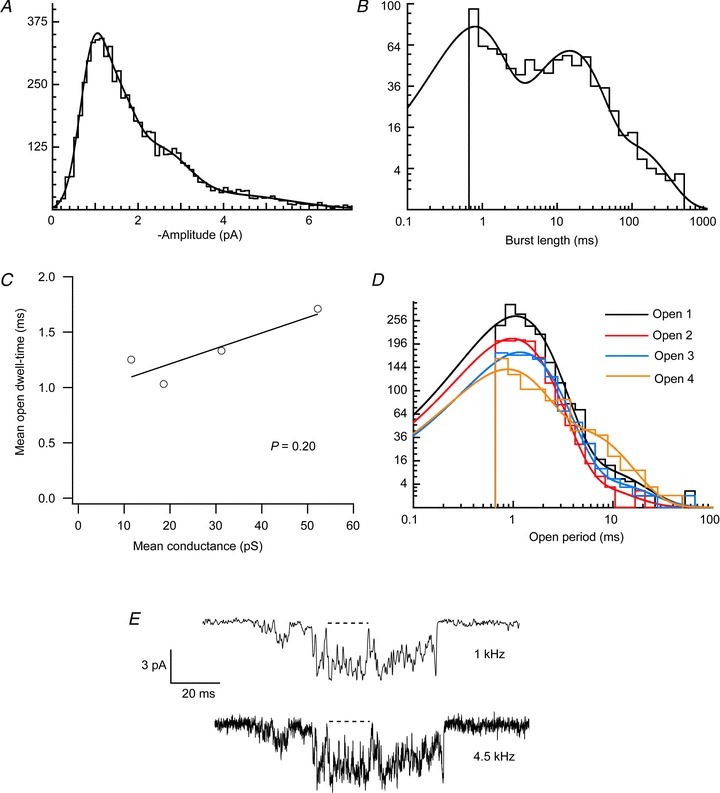
Figure 8. Pooled analysis of GluA1/γ-4 patches with similar current amplitude histograms (see Fig. 6).

A, amplitude histogram fitted with four components (see text for parameter values). B, burst length histogram fitted with three components (see text for parameter values). C, absence of significant correlation between conductance level and mean dwell-time of each conductance level. D, open period histograms for each conductance level required two exponential components to allow an adequate fit (see text for parameter values). E, open period times are ‘apparent’ open times, due to the imposed filtering and resolution. Reducing the filtering from 1 kHz to 4.5 kHz demonstrates that apparent open periods seen in the former condition can be interspersed with brief shuttings when less filtering is applied; this would act to reduce the actual duration of the open period. However, the presence of these brief shuttings would not alter the number of open period components detected.
