
Figure 3. Summary of potentiation of GABA responses.
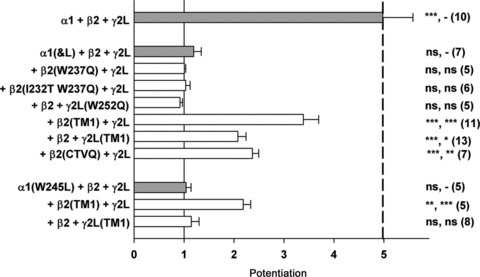
The mean (± SEM) potentiation by 1 μm 3α5αP is shown. The combinations of subunits are grouped as follows: top combination is all wild-type subunits; the next group all contain α1(I&L) with various constructs; and the bottom group all contain α1(W245L). The thin vertical continuous line shows a value of 1 (no potentiation), and the thick dashed line shows the mean potentiation for wild-type receptors. The symbols to the right of the bars indicate probability that potentiation differs significantly from 1 (that is no effect; two-tailed paired t test) and from the potentiation from the initial combination in the group (e.g. α1(I&L) +β2 +γ2L; one-way ANOVA with Dunnett's post hoc correction) (initial combination, NS P > 0.05, *P < 0.05, **P < 0.01, ***P < 0.001). Data values are presented in Table 1.