
Figure 6. Regression plots between changes in short-interval intracortical inhibition (SICI; x-axes) induced by priming TBS and changes in MEP amplitude (Δmotor-evoked potential (MEP), y-axes) induced by primed TBS minus non-primed TBS in Experiment 1 (A) and Experiment 2 (B).
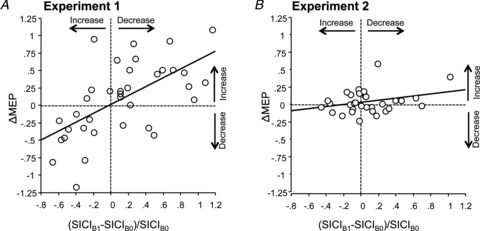
The thick lines indicate regression lines. Note the significant linear correlation between changes in SICI and ΔMEP in Experiment 1.