
Figure 1. Short-term synaptic plasticity of STR–GP and GP–GP synapses under physiological conditions.
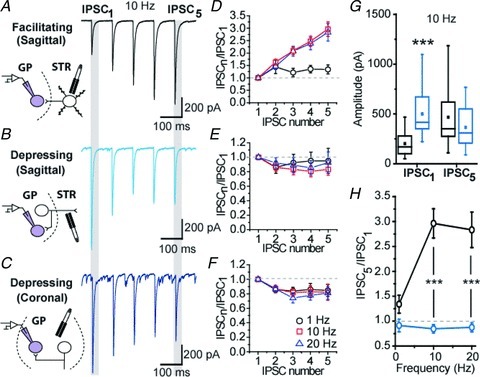
A–C, examples of electrically evoked trains of IPSC at 10 Hz frequency. Drawings depict the putative synapses stimulated for each experimental condition. D–F, graphs showing normalized IPSC amplitude. G, graph showing the amplitude of the first and last IPSCs in the train at a frequency of 10 Hz. H, summary graph of the normalized amplitude of the last IPSC (IPSC5/IPSC1) of the train. ***P < 0.001 vs. facilitating synapse, MW U test.