
Figure 9. Increased GP–GP inhibition resets more efficiently autonomous pacemaking and promotes rebound-burst firing.
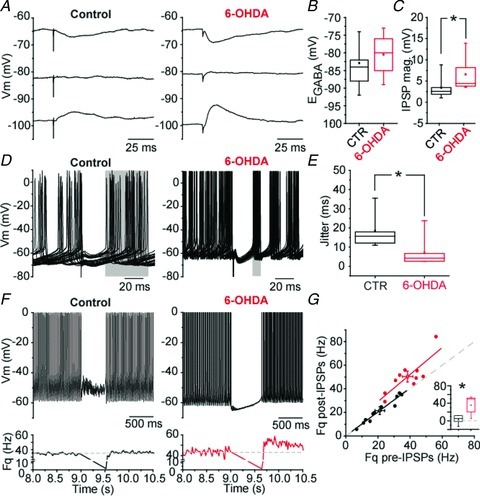
A, representative examples of GABAergic IPSPs evoked at various membrane potential. B, graph depicting GABAA receptor-mediated IPSP reversal potential (EGABA; control, n= 9; 6-OHDA, n= 9; P= 0.289, MW U test). C, plot showing the significant increase in the magnitude of IPSPs in dopamine-depleted conditions measured at a potential of −65 mV (control, n= 9; 6-OHDA, n= 6; P= 0.039, MW U test). D, plots illustrating the impact of single IPSP in the resetting of GP neuron autonomous pacemaking (overlay of 30 traces in each conditions). E, graph representing the jitter of the action potential following the IPSP (control, n= 5; 6-OHDA, n= 7; P= 0.03, MW U test). F, examples of the effect of a train of IPSP (25 pulses; 50 Hz) on GP neurons firing. The graph below each trace indicates the modification of instantaneous frequency. The dash lines indicate the mean firing frequency before the train of evoked IPSPs. G, correlation graph between the pre-IPSP firing frequency (measured over a duration of 500 ms) and the post-IPSP firing frequency (measured over a duration of 300 ms). Inset, summary graph showing the significant change in post-IPSP firing frequency in dopamine-depleted conditions (control, n= 11; 6OHDA, n= 10; P= 0.003, MW U test).