
Figure 3. Variation in ICaT amplitudes in zinc-injected CA1 pyramidal cells.
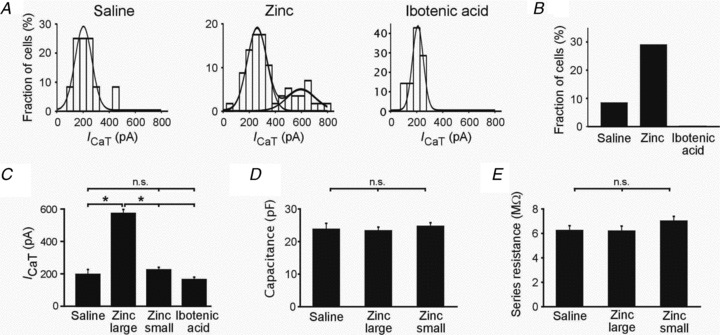
A, amplitude distribution histograms of ICaT amplitudes in CA1 pyramidal cells from saline-, zinc- and ibotenic acid-injected animals. The histograms were fitted with Gaussian curves and show the appearance of a subpopulation of cells with larger ICaT in zinc-injected animals. B, bar graph showing fraction of neurons in the three groups of animals manifesting ICaT larger than 370.1 pA (mean + 2SDs of ICaT in the saline-injected group). C, bar graph comparing ICaT amplitudes (recorded at a test pulse potential of −45 mV) in the two neuron subgroups from zinc-injected animals versus ICaT amplitudes in neurons from saline- and ibotenic acid-injected animals. D, bar graph showing similar capacitance of the two neuron subgroups from zinc-injected animals and saline-injected animals. E, bar graph showing similar series resistance of the two neuron subgroups from zinc-injected animals and saline-injected animals.