
Figure 4. Blockade of ICaT by nickel.
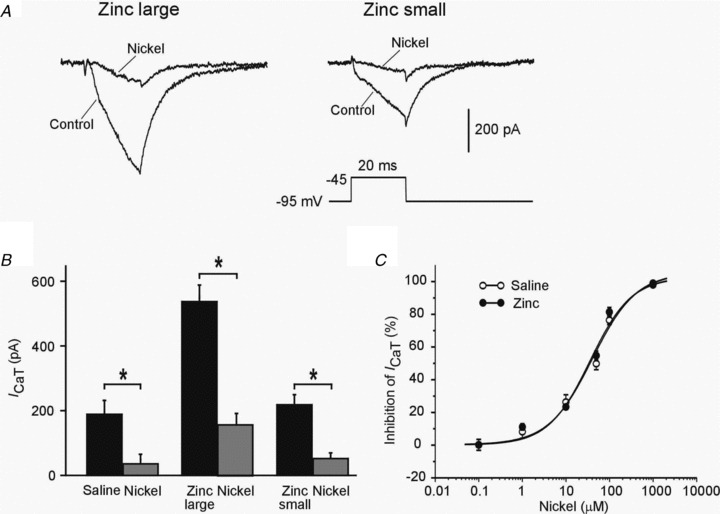
A, representative traces of ICaT before (Control) and 5 min after adding 100 μm nickel to the aCSF (Nickel) in the two neuron subgroups from zinc-injected animals. B, bar graph showing the similar blocking effect of 100 μm nickel on ICaT in the two neuron subgroups from zinc-injected animals (n= 4 for each subgroup) and saline-injected rats (n= 3). C, concentration–response curve for nickel on ICaT in cells from saline-injected rats (n= 3; open circles) and zinc-injected rats (n= 5; filled circles). Data were fitted with a Hill equation using a Levenberg–Marquard non-linear curve-fitting procedure. The fitted lines are shown superimposed on the data points for saline- and zinc-injected rats, and are almost indistinguishable.