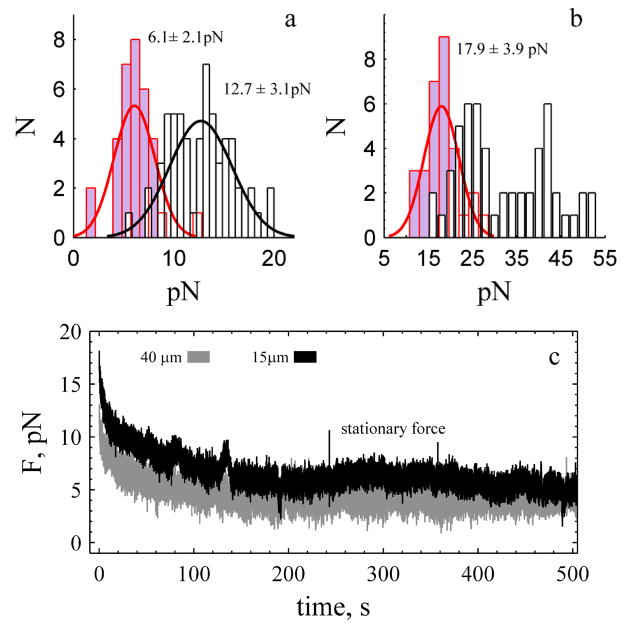
Fig. 2.
Stationary force is independent of tether length with and without cytochalasin E in the bath. a. Stationary force for tubes of all lengths under control (white, N: 60) and in presence of cytochalasin E (lavender, N: 33). b. Force measured at end of tube elongation. In presence of cytochalasin E the force exhibits a single distribution (N: 30), white represents the control. Solid black and red lines are normal probability distribution functions. c. Force measured during relaxation in presence of cytochalasin E. The stationary values are 3.7 ± 0.9 pN (grey) and 6.2 ± 1.0 pN (black). The force measured at zero time represents the force at the end of tube elongation.

