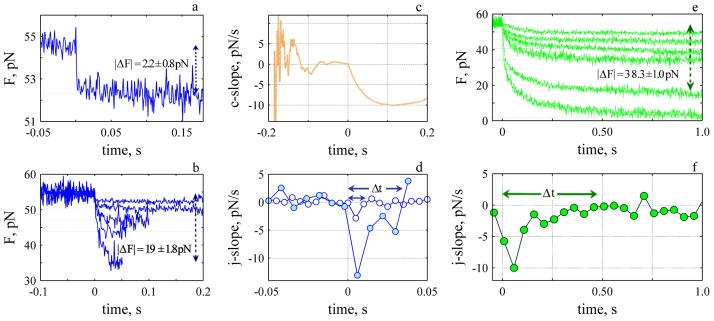
Fig. 5.
The rate of decay depends upon the force and exhibits a fast (a–d) and slow (e–f) time course. a. Fastest and smallest decay average of 24 events. b. Five fastest decay events. c. The c-slope for decay shown in a. d. j-slopes for the smallest (open circles) and largest (closed circles) events shown in b. e. Six slowest decay events and (f) corresponding j-slope for one of them, Δt: 489 ms average of 3 events.

