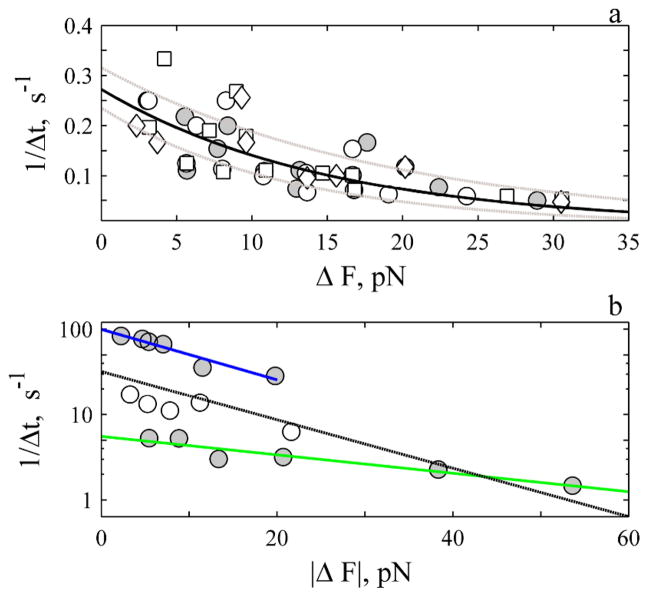
Fig. 6.
The rate of rise (a) and decay (b) decreases exponentially with magnitude of ΔF. a. Open symbols are events under control conditions (circles, N: 71), in presence of 2–20 μM ML-7 (squares, N: 44) and 10 μM nocodazole (diamonds, N: 18). There is no difference between control and treatments (P-value > 0.8). The solid circles represent average of all events (control and treatments) that exhibit the same force and time course. The solid line is best fit of all events to E.3. The dashed grey lines are the confidence interval of the estimates. The j- slope was determined with up to 500 ms of data for events ΔF < 20 pN and with 1 s of data for events ΔF > 20 pN. b. The solid circles represent the average decay for the fast (upper N: 41) and slower (lower N: 18) events. The open symbols represent events in-between the two extremes (N: 19). The j-slope was calculated with 5 and 8 ms of data for fast events and with 30 ms of data for the slow events. The blue (fast) and green (slow) lines are best-fit of data to E. 4. The black line is average fit, (see ES1, Table S1).

