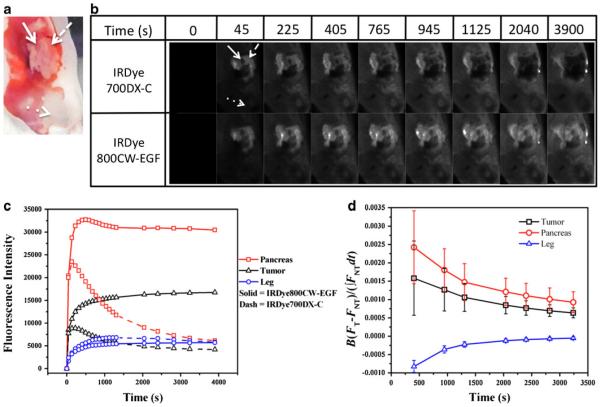
Fig. 3.
The cellular associated rate constant (k23) was determined by using a dual-inject technique where both the targeted (IRDye800CW-EGF) and nontargeted (IRDye700DX-C) agents were in administered simultaneously. a A representative image of the normal pancreas (dashed arrow), AsPC-1 tumor (solid arrow) and the reference leg (dotted arrow) of a mouse prepared for imaging the dual agents. b A representative time-course of the mouse from (a) showing both the simultaneously imaged IRDye800CW-EGF and the IRDye700DX-C agents at various time points. c The time course for each tissue type in a specified ROI from (b) is shown here with normal pancreas (red), AsPC-1 tumor (black) and leg (blue). d The average k23 rate constants over time are shown, where the k23 rate constant is determined by fitting the asymptote of each curve.

