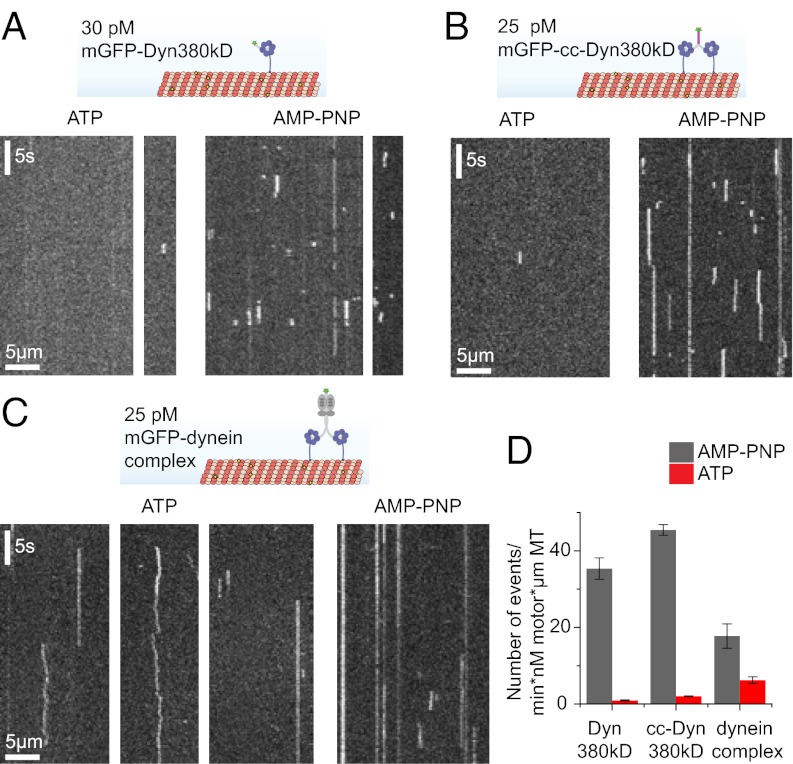
Fig. 4.
Single-molecule behavior of human dynein. (A–C, Upper) Schematic of the assay showing individual mGFP-labeled dyneins on fluorescent MTs that are imaged using TIRFM. (A–C, Lower) Exemplary kymographs (space–time plots) show individual monomeric Dyn380kD (A), dimeric cc-Dyn380kD (B), and dynein complex (C) molecules interacting with MTs in the presence of ATP or AMP-PNP, as indicated. (D) Total number of binding events per minute and per concentration of motor (nM) and MT length (µm). Error bars are SEM. Number N of independent experiments: dynein complex with ATP (n = 4) and AMP-PNP (n = 2), cc-Dyn380kD with ATP (n = 3) and AMP-PNP (n = 2), and Dyn380kD with ATP and AMP-PNP (both n = 2). The motor concentrations in this figure refer to monomers for Dyn380kD and dimers for cc-Dyn380kD and the dynein complex.

