


Table 1.
CD4+ T-cell response to alanine-variant peptides
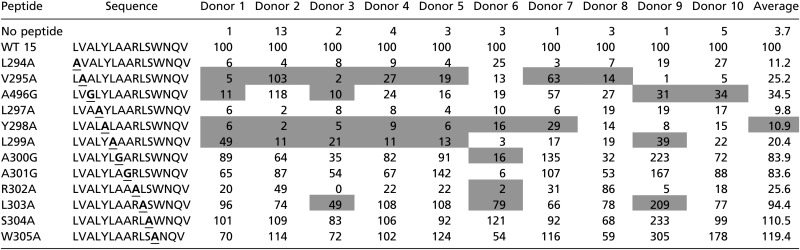 |
Data are shown as percent of response to WT peptide. Gray shading indicates a response of <10% to WT peptide. Boldface and underlining indicate the amino acid residues that were changed.
Official websites use .gov
A
.gov website belongs to an official
government organization in the United States.
Secure .gov websites use HTTPS
A lock (
) or https:// means you've safely
connected to the .gov website. Share sensitive
information only on official, secure websites.
CD4+ T-cell response to alanine-variant peptides
|
Data are shown as percent of response to WT peptide. Gray shading indicates a response of <10% to WT peptide. Boldface and underlining indicate the amino acid residues that were changed.