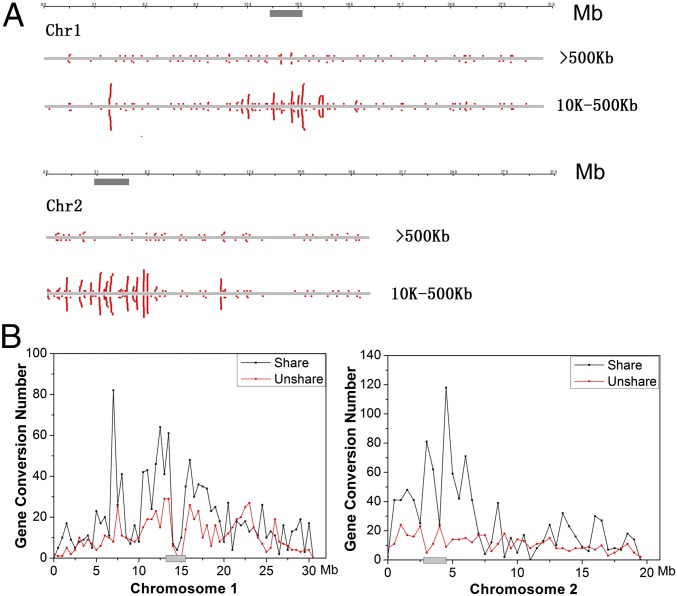
Fig. 2.
Distribution of (A) COs and (B) gene conversions on chromosomes 1 and 2. The long (>500 kb) and small COs (10-500 kb) are showed separately. Shared and nonshared gene conversions (20 bp to 10 kb) are demonstrated by different lines. The centromere regions were represented as gray bars. Only those gene conversions in Table 2 were used.

