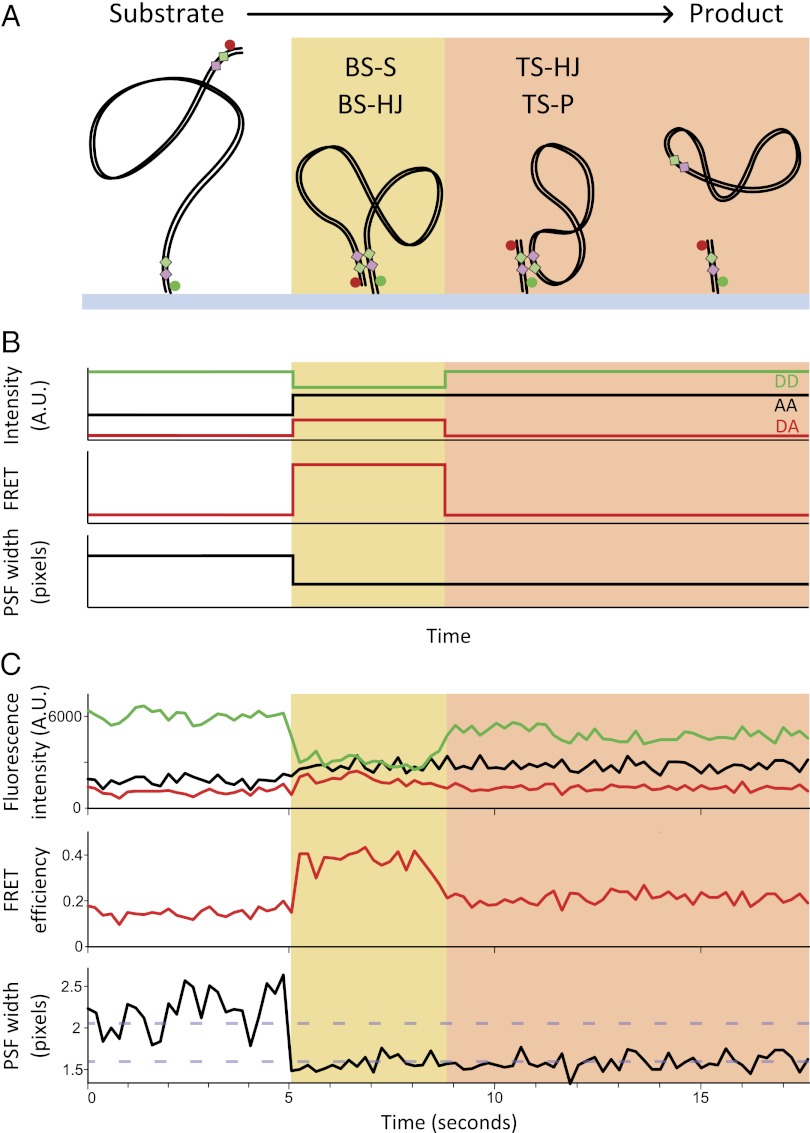
Fig. 2.
Single-molecule recombination observed in real time. (A) Schematic of BS FRET substrate during BS recombination. (B) Expected emission intensities of donor (DD, green) and acceptor under green excitation (DA, red) and acceptor under red excitation (AA, black). DD and DA are used to calculate apparent FRET efficiency (E*), and the PSF width of the acceptor is obtained from AA images. The stages of reaction (Fig. 1A) giving rise to each of these states are indicated. (C) Representative time trace of a productive recombination event.

