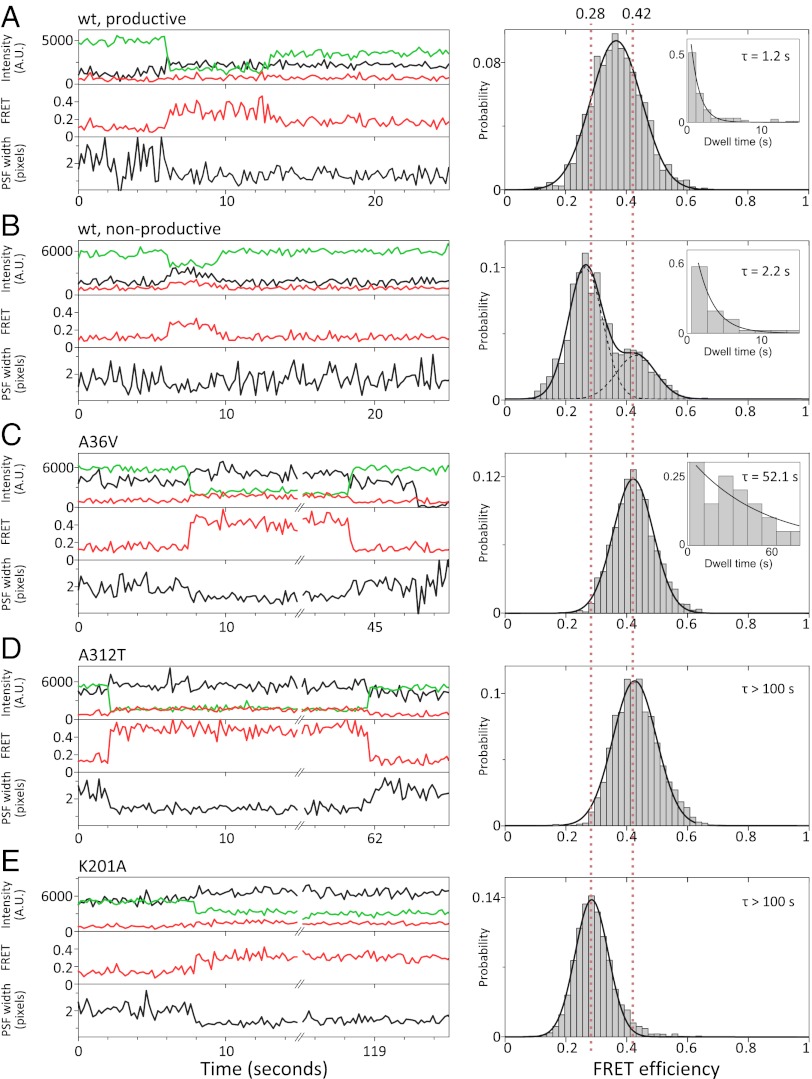
Fig. 3.
FRET efficiency histograms of protein–DNA complexes for wild-type Cre and mutants. Example time traces and population histograms for (A) wt Cre productive events (91 molecules). (B) wt Cre nonproductive synaptic complex events (48 molecules). (C) Cre A36V (27 molecules), (D) Cre A312T (25 molecules), and (E) Cre K201A (86 molecules). Histograms were plotted with E* values from each frame of an event, counts added to the histogram were normalized by the length of the event to more accurately represent the population of molecules, and histogram area was normalized to one (SI Text). Guidelines of E* = 0.42 and 0.28, corresponding to the expected BS-HJ FRET efficiency and that measured for the K201A mutant, respectively, are shown as red dotted lines. Dwell times of molecules in A, B, and C were fit to single exponentials (insets, mean lifetimes shown). D and E show very stable complexes, and dwell times could not be measured over the duration of our experiments.

