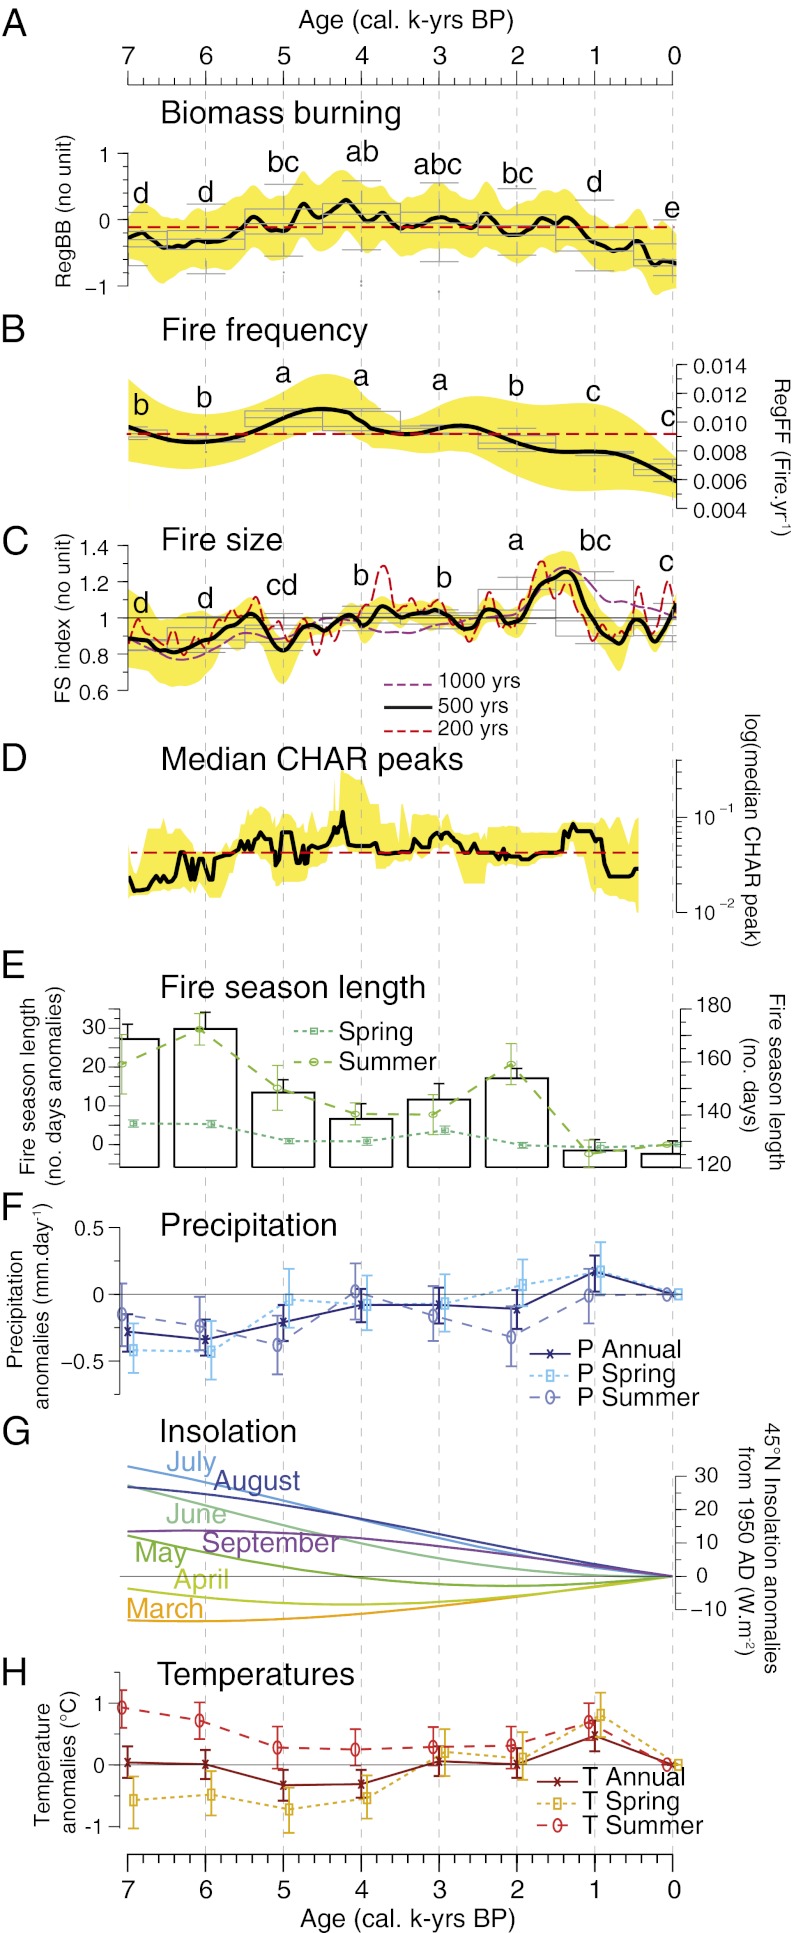
Fig. 1.
Reconstructed fire regime history based on the analysis of lacustrine charcoal deposits. (A) Biomass burning (RegBB) using total charcoal influx. Black line corresponds to the smoothing values using a LOWESS function (500-y time window). The yellow area corresponds to the 90% bootstrap confidence intervals (BCI). The median value for the sequence is represented by the red dashed line. Detected trends were confirmed by box-plot analysis carried out for each 1,000-y period; significance between millennia was assessed using the Wilcoxon rank sum test. A stable amount of biomass that burned from 5.5 to 1.5 kya and a decrease thereafter are recorded. (B) Fire frequency (RegFF) using the peak components of total charcoal influx, displaying a significant decrease in fire frequency after 3.0 kya. A Gaussian kernel smoothing with a bandwidth of 500 y was used to illustrate the RegFF trend. (C) Fire size (FS index) computed from the ratio RegBB/RegFF and indicating a significant shift from frequent but small wildfires to infrequent but larger events. The black line represents the median of simulated FS index for the 500-y bandwidth; the 200- and 1,000-y bandwidths are represented by the dashed red and purple lines, respectively (Materials and Methods). (D) Median CHAR peak values (PEAKMED) computed across a moving window of 23 fire events (∼500-y window; Materials and Methods). PEAKMED is herein used as a proxy for fire size. The median value for the sequence is represented by the red dashed line. A gradual increase in PEAKMED was recorded up to 1.5 kya. (E) Fire season length assessed on the basis of the number of days with simulated monthly means of daily drought code (DC) values higher than 80 units, showing a decrease in fire-season length over the last 7000 y (spring and summer DCs are indicated by dotted and dashed lines, respectively). Error bars denote the SDs. (F) Simulated annual and seasonal precipitation by the UGAMP model (anomalies relative to preindustrial control period (0 kyBP) assumed to be representative of the present-day conditions). (G) Monthly radiative insolation at 45°N (35) showing a decrease during the summer months (July to September) and an increase during the spring months (April to June). (H) Simulated annual and seasonal air temperatures by the UGAMP model (the same preindustrial period for the present-day reference and anomaly calculation), showing a significant increase in spring temperatures during the last 3.0 ky.

