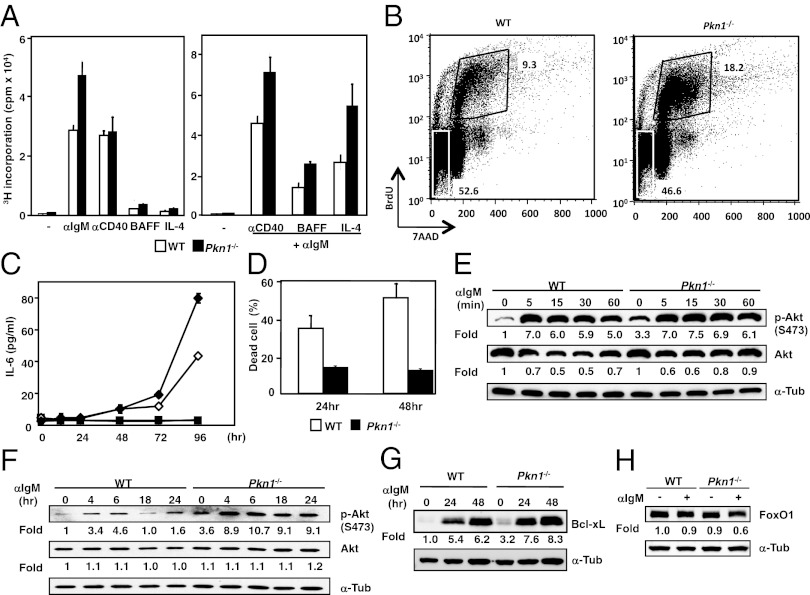
Fig. 4.
PKN1 regulates the proliferation and survival of B cells by inhibiting Akt. (A) Purified B cells were cultured for 72 h with the indicated stimuli. Cultures were pulsed with 3[H]thymidine for 12 h. Error bars show the mean ± SEM. Data are representative of three independent experiments. (B) B cells purified from splenocytes were stimulated with an anti-IgM F(ab)2 for 24 h and pulsed with 10 nM BrdU for 12 h. The cells were harvested and stained with an anti-BrdU antibody and 7-Aminoactinomycin D (7-AAD) for FACS analysis. The numbers in the figure show the percentage of gated cells relative to the total cell number. Data are representative of three independent experiments. (C) Splenic B cells from either WT (open) or Pkn1−/− mice (closed) were stimulated with (diamonds) or without (squares) an anti-IgM F(ab)2 and anti-CD40 antibody for the indicated time periods. IL-6 production was examined by ELISA. Representative data from three independent experiments are shown. (D) BCR-mediated AICD. B cells purified from WT and Pkn1−/− spleens were stimulated with an immobilized anti-IgM F(ab)2 for the indicated time periods. (E and F) Akt phosphorylation in B cells is mediated by BCR signaling. Numbers represent the fold induction normalized to the protein levels of nonstimulated WT. (G) Bcl-xL protein expression induced by BCR ligation. Numbers represent the fold change normalized to the WT protein level without BCR stimulation. (H) B cells were stimulated with an anti-IgM F(ab)2 for 8 h. FoxO1 protein level was determined by Western blotting. Fold change denotes the values that were normalized to the protein level from WT lysates that were stimulated in the absence of an anti-IgM antibody.

